
Energy produced by hydroelectric power receives its main federal subsidies through government ownership.
CHAPTER TWENTY-EIGHT
Government Financial Subsidies
Skip to Report
Chapter 28
Government Financial Subsidies
Introduction
Previous chapters examined fuel sources and efficiency measures that might help meet Texas’ energy needs. This chapter will examine one aspect of government involvement in the energy industry: financial subsidies.
As noted in the Overview to this report (Chapter 2), and in the chapters discussing specific fuel sources, government action can affect the development of energy resources. This chapter discusses one form of government action – financial subsidies directed at specific fuel sources. In order to make comparisons across fuel sources, this chapter estimates financial subsidies for the most recent year for which complete data were available, 2006.
What are Governmental Financial Energy Subsidies?
In May 1999, the Office of Policy at the U.S. Department of Energy asked the Energy Information Administration (EIA) to prepare an update of its 1992 Service Report on federal energy subsidies, using a more specific definition of “subsidies” provided by the Office of Policy. In their letter requesting the study, the Office of Policy asked the EIA to examine programs through which government or a public body provided a “specific financial benefit” covering “primary energy only” (As opposed to efficiency standards or similar services not tied to specific fuel sources). 1
For many years, federal, state and local governments have provided subsidies to energy producers and purchasers to encourage the development and production of various fuel sources. These subsidies provide financial support for specific industries in the form of tax incentives, direct spending, research and development funds and other support mechanisms.
The federal government has traditionally used financial subsidies to encourage the development of new energy sources, to improve the extraction or production of the energy source, or to encourage domestic production of the energy source.
As early as 1916, the federal government instituted income tax incentives to encourage individuals and corporations to drill for oil. During the 1930s, federally financed dams created hydroelectric power. From the 1950s onward, the federal government financed research into nuclear power. More recently, the federal government has provided research funding and other financing to expand the availability of renewable energy sources. 2 Virtually all U.S. energy resources have received or currently receive subsidies.
As a result of this complex web of subsidies, Texans as both energy consumers and federal, state and local taxpayers may pay more for some energy sources than is reflected in their electric bill or the posted price at the gas station. Finding the cost of energy produced by different fuels has implications for the choices made by individual Texans, Texas businesses and policymakers.
Previous Energy Subsidy Studies
Relatively few studies examining federal energy subsidies for different types of fuels have been conducted, and some of those are more than five years old and thus do not include the results of major recent changes in federal law. Still other studies provide figures on total subsidies, but relatively little detail on which subsidies are included in their estimates.
Practical difficulties may explain why so few studies of federal subsidies have been completed. Detailed assessments of federal subsidies across multiple fuels require months of work and a wide scope of knowledge. The necessary data often are lacking and many incentives are difficult to quantify. Furthermore, subsidies for energy sources occur in many government programs across multiple agencies, and the U.S. government itself does not compile comparative information about them.
For these reasons, examinations of subsidies and costs applicable to different fuel sources tend to be infrequent and incomplete. Chapter 30 lists some additional subsidy studies.
Comptroller’s Energy Subsidy Study
Due to the lack of up-to-date, documented data on federal fuel subsidies, the Texas Comptroller of Public Accounts has undertaken an independent estimate. In addition, the agency has documented Texas state and local government subsidies for different types of fuels, to examine their total cost for Texas taxpayers and consumers.
Exhibit 28-1
The Comptroller’s estimates focus on federal, state and local government financial subsidies for different fuel sources. Financial subsidies provide the most direct governmental incentives for businesses to produce a particular type of fuel. While it is impossible to capture all government support for different energy sources, even partial evaluations can suggest the scale and comparative levels of support. This study does not include externalities such as environmental or health costs, because they often occur outside the scope of a single year and are difficult to quantify and tie to a single fuel source.
The Comptroller’s office has completed an estimate of federal, state and local subsidies for fuels for 2006. Unless otherwise noted, federal subsidies are for the federal fiscal year (FFY), which runs from October 1, 2005 to September 31, 2006; Texas state subsidies are for the state fiscal year (FY), which runs from September 1, 2005 to August 31, 2006; and Texas property tax subsidies are for the 2006 calendar year.
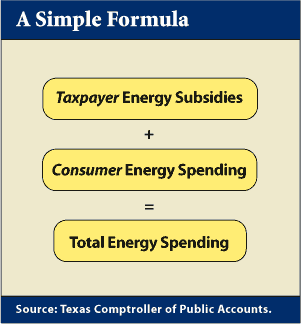
This chapter focuses on identifying energy expenditures of different types of fuels through a relatively simple formula (Exhibit 28-1).
This analysis does not include subsidies for energy storage or conservation, since this study focuses on subsidies to fuel types. Subsidies are allocated to specific fuel sources unless information is not available. (See Appendix 2 for more information on the Comptroller’s methodology and why some types of subsidies were included and excluded.)
Federal Energy Subsidies
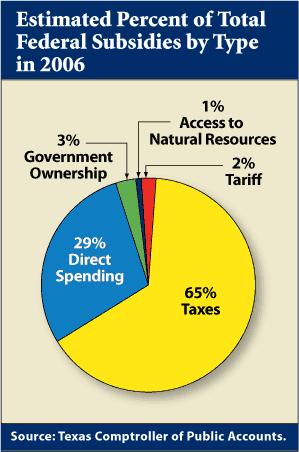
The federal government provides financial energy subsidies through tax incentives; direct spending for government services; the assumption of certain types of liability or risk by the federal government; government ownership of energy production; access to resources on federal lands and tariffs (Exhibit 28-2).
Exhibit 28-2
View Exhibit 28-2: Estimated Percent of Total Federal Subsidies by Type in 2006, in Table Format.
The federal government offers energy producers and purchasers tax incentives, such as credits, deductions, exemptions and allowances. For example, purchasers of clean-fuel burning vehicles may receive a federal income tax credit.
The federal government provides grants and loans to encourage the development and purchase of certain energy systems, such as the purchase of renewable energy systems. Grants and loans are two examples of direct federal spending. Direct spending (also called direct expenditure) is a term used by previous studies of energy subsidies to describe federal programs through which the federal government provides direct financial benefits to energy producers or consumers. 3
Grants are counted at full face value since they are a direct financial benefit to the grantee. Loans are counted only to the extent that they lower the “price” of money to the loan recipients. Government loans may come with lower interest rates, so the differential between a commercial interest rate and the government rate is the only subsidy counted. Previous studies of energy subsidies count loans in this manner, and have concluded that providing loans is “widely recognized as an energy subsidy.” 4
The federal government appropriates funds for government services for the energy industry that are not covered by industry fees or trust funds. The most common direct spending appropriation is for research and development for a specific type of fuel, for example, research and development for solar energy. This study does not include federal spending for regulatory activities.
The federal government can assume part of the risk for the activities of energy producers, for example, assuming part of the risk and fiscal responsibility for the cost of nuclear power accidents. These are costs that would otherwise need to be paid under a private commercial insurance plan.
The federal government owns some energy production facilities, especially hydroelectric dams. The cost of operating these facilities may be subsidized, for example, when the federal government does not charge energy consumers the full amount of the costs to produce the energy. The facility receives direct appropriations from the federal government and, unlike a private company, does not have to make all of its revenues from ratepayers.
The federal government provides access to federally owned lands for energy producers. These lands may be leased for their natural resource production. Some subsidy studies point to reduced royalties for oil leases on government lands, where the federal government receives below-market value for oil royalties. Sales of timber from federal parks and forests may be similarly low-priced. The amount of the below-market pricing is the amount of the subsidy counted in this study.
Finally, tariffs may restrict the importation of foreign fuel and favor domestic energy producers. The U.S. tariff on Brazilian ethanol is one example. It allows U.S. ethanol producers to sell their product at higher prices than they would be able to charge if they had to compete with cheaper, imported ethanol if there were no tariff. In this instance, the subsidy total is the amount of the tariff collected from ethanol importers.
Exhibit 28-3 describes and provides examples of these subsidies.
Exhibit 28-3
| Types of Financial Subsidies | Descriptions | Examples |
|---|---|---|
| Taxes | Special tax credits, deductions, exemptions and allowances related to the federal tax code |
|
| Direct Spending | Annual federal appropriations for government services, grants or loans, frequently for research and development (this does not include the costs of regulatory agencies or costs covered by industry fees or trust funds) |
|
| Liability/Risk Assumption | Assumption of liability or risk by the federal government for activities of energy producers |
|
| Government Ownership of Energy Production | Federal ownership of hydroelectric power and other power generating facilities |
|
| Access to Resources on Federal Lands | Government-owned resources which are leased or sold to energy producers at below-market pricing |
|
| Tariffs | Tariff restricting import of ethanol |
|
Source: The Texas Comptroller of Public Accounts.
Texas State and Local Energy Subsidies
Like the federal government, Texas state and local governments also provide tax incentives (Exhibit 28-4). For example, Texas gives an exemption from the oil and gas severance tax to encourage producers to re-open wells that have not produced for the previous two years and property tax exemptions are available for energy producers as well. Additionally, Texas local utilities provide homeowner incentives, such as rebates for installing solar photovoltaic systems.
Exhibit 28-5
Exhibit 28-4
| Types of Financial Subsidies | Descriptions | Examples |
|---|---|---|
| Taxes | Special tax credits, deductions, exemptions, allowances and property tax incentives |
|
| Homeowner incentives | Rebates, leasing/lease purchase programs |
|
| Direct Spending | Grants compiled of funds received from industry fees and matching general revenue funding |
|
Source: Texas Comptroller of Public Accounts.
Total Federal Subsidies by Fuel Source
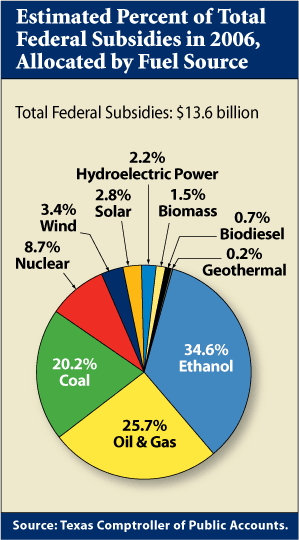
The Comptroller’s office estimates that the total amount of federal energy subsidies for 2006 was $13.6 billion. Ethanol had the largest share, at $4.7 billion, or 34.6 percent of total subsidies. The share of federal subsidies by fuel source is shown in Exhibit 28-5.
Total Consumer Spending at the Federal Level
One way to evaluate the amount of governmental subsidies is to compare them to the national total of consumer spending for each source of fuel. Exhibit 28-6 shows federal subsidies for 2006 as compared to national level spending for each fuel source.
Exhibit 28-6
| Energy Source | Federal Taxpayer Subsidies | Total Energy U.S. Consumer Spending | Total Spending on Energy Source | Federal Taxpayer Subsidies as a Percent of Total Spending |
|---|---|---|---|---|
| Oil and Gas** | $3,502,732,143 | $772,404,554,400 | $775,907,286,543 | 0.5% |
| Coal | $2,754,908,000 | $37,228,867,200 | $39,983,775,200 | 6.9% |
| Nuclear | $1,187,426,000 | $4,506,192,000 | $5,693,618,000 | 20.9% |
| Subtotal Nonrenewable | $7,445,066,143 | $814,139,613,600 | $821,584,679,743 | 0.9% |
| Ethanol | $4,708,277,549 | $13,082,400,000 | $17,790,677,549 | 26.5% |
| Biodiesel | $92,315,835 | $840,350,000 | $932,665,835 | 9.9% |
| Wind | $457,924,289 | $3,502,105,629 | $3,960,029,918 | 11.6% |
| Solar | $382,756,318 | $2,731,644,481 | $3,114,400,799 | 12.3% |
| Hydroelectric power | $295,234,608 | $56,123,748,494 | $56,418,983,102 | 0.5% |
| Biomass | $209,641,875 | $50,421,528,417 | $50,631,170,292 | 0.4% |
| Geothermal | $29,158,534 | $5,825,057,818 | $5,854,216,352 | 0.5% |
| Subtotal Renewables | $6,175,309,008 | $132,526,834,839 | $138,702,143,847 | 4.5% |
| Total Subsidies | $13,620,375,151 | $946,666,448,439 | $960,286,823,590 | 1.4% |
*Federal fiscal years run from October 1 to September 30.
**‘Oil and gas’ includes natural gas production, crude oil production and natural gas plant liquids production.
Source: Energy Information Agency and Texas Comptroller of Public Accounts.
Texas State and Local Energy Subsidies
The Comptroller’s Office also compiled an estimate of state and local energy subsidies for 2006. In Texas, state and local subsidies totaled $1.4 billion in 2006. Oil and gas garnered most of the subsidies with an estimated 99.6 percent. However, the oil and gas subsidies constituted only 1.5 percent of all Texas spending on oil and gas since the estimated total spending on the oil and gas industry was $94.7 billion in 2006.
Texas Consumer Spending at State and Local Levels
Exhibit 28-7 shows Texas state and local subsidies for 2006 as compared to state spending on each fuel source.
Exhibit 28-7
| Energy Source | Texas State and Local Subsidies | Total Texas State and Local Consumer Spending | Total Spending on Energy Source | Texas State and Local Subsidies as a Percent of Total Texas Spending on Energy |
|---|---|---|---|---|
| Oil and Gas | $1,417,434,337 | $93,326,324,400 | $94,743,758,737 | 1.5% |
| Coal | n/a | $2,207,721,600 | $2,207,721,600 | 0.0% |
| Nuclear | n/a | $197,251,200 | $197,251,200 | 0.0% |
| Subtotal Nonrewables | $1,417,434,337 | $95,731,297,200 | $97,148,731,537 | 1.5% |
| Ethanol | n/a | $93,539,160 | $93,539,160 | 0.0% |
| Biodiesel | $2,107,420 | $65,967,475 | $68,074,895 | 3.1% |
| Wind | $1,508,800 | $833,501,140 | $835,009,940 | 0.2% |
| Solar | $2,574,101* | $25,458,927 | $28,033,028 | 9.2% |
| Hydroelectric power | n/a | $276,128,843 | $276,128,843 | 0.0% |
| Biomass | n/a | $1,401,718,490 | $1,401,718,490 | 0.0% |
| Geothermal | $45,400 | $18,698,436 | $18,743,836 | 0.2% |
| Subtotal Renewables | $6,235,721 | $2,715,012,471 | $2,721,248,192 | 0.2% |
| Total | $1,423,670,058 | $98,446,309,671 | $99,869,979,729 | 1.4% |
n/a: not applicable
*$2,074,101 of this total comes from Austin Energy utility company.
Sources: U.S. Energy Information Administration and Texas Comptroller of Public Accounts.
Federal, State and Local Subsidies as a Percent of Consumer Spending
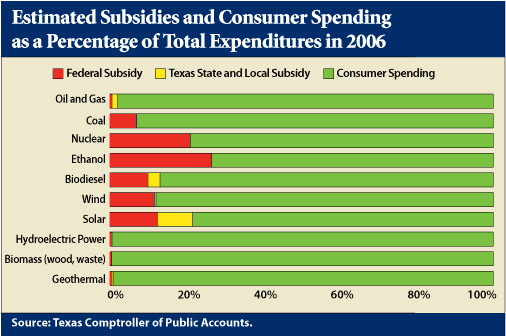
The Comptroller estimates that in 2006 the federal government subsidized 26.5 percent of the cost of ethanol consumer purchases, while no state or local subsidies were granted for ethanol in 2006. The federal government subsidized 9.9 percent of consumer purchases for biodiesel, and Texas state and local governments subsidized 3.1 percent. Exhibit 28-8 shows subsidies and consumer spending as a percentage of total expenditures in 2006, by fuel source.
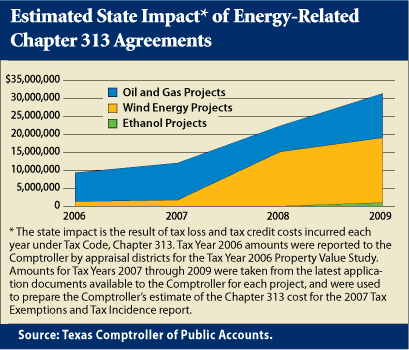
Exhibit 28-9
View Exhibit 28-9: Estimated State Impact of Energy-Related Chapter 313 Agreements, in Table Format.
Chapter 313 Property Value Limitations
It is important to note that Exhibit 28-8 does not reflect changes in federal, state and local subsidies that occurred after 2006. One notable change is the rising trend in Texas property tax value subsidies, such as Chapter 313 property value limitations, which have a significant impact on the Texas budget.
Under Chapter 313 of the Texas Tax Code, school districts may provide Property Value Limitations to businesses by offering a tax credit and an eight-year limitation on the appraised value of a property, for the maintenance and operations portion of the school district property tax. In exchange for the value limitation and tax credit, the property owner must enter into an agreement with the school district to create a specific number of jobs and build or install specified types of real and personal property worth a certain amount. 5 The 2007 Legislature required the Comptroller to provide a report before the beginning of each regular legislative session assessing the progress of each agreement made under Chapter 313. 6 Exhibit 28-9 illustrates the projected increase in the Chapter 313 incentive. Based on data collected for the legislatively mandated study, these estimates may be revised later in 2008.
Spending on Nonrenewable Energy
The Comptroller estimates that the U.S. consumers spent approximately $814.1 billion to generate energy from nonrenewable sources in 2006. This estimate is taken at the time a consumer – either a homeowner or utility company – decides to purchase a type of fuel. Total 2006 spending on nonrenewables, including subsidies, is estimated at $821.6 billion. Nonrenewable subsidies comprised about $7.4 billion of that amount, or less than one percent.
Detail: Oil and Gas Subsidies
Federal Oil and Gas Tax Subsidies
Federal oil and gas subsidies come in the form of tax incentives for producers and investors; reduced royalties paid by producers for oil leases on federal lands; very small, targeted appropriations to pay for oil and gas research and development; and appropriations for pipeline safety programs and the nation’s Strategic Petroleum Reserve.
In 2006, federal tax subsidies for the oil and gas industry amounted to an estimated $3.5 billion, based on tax data from the U.S. Office of Management and Budget (OMB) and additional analysis by the Comptroller. The largest oil and gas tax subsidies are the Expensing of Exploration and Development Costs Credit, the Percentage Depletion Allowance and the Alternative Fuel Production Credit. All are intended to increase the production of domestic oil and gas.
The Expensing of Exploration and Development Costs Credit allows investors in oil or gas exploration and development to “expense” (to deduct from their corporate or individual income tax) intangible drilling costs (IDCs). IDCs include wages, the costs of using machinery for grading and drilling and the cost of unsalvageable materials in constructing wells. These costs are “intangible” in comparison to costs for salvageable expenditures (such as pipes or casings) or costs related to acquiring property for drilling. The credit enables oil and gas producers to immediately write off as an expense these costs from income taxes rather than amortize them (spread the deductions out) over the productive life of the property.
This tax credit, intended to encourage domestic oil and gas exploration, was originally implemented through federal regulations in 1916; it became law in 1954. The Congressional Research Service has estimated that the Expensing of Exploration and Development Costs tax credit was worth $1.1 billion to the oil and gas industry in 2006. 7
The Percentage Depletion Allowance permits independent fuel mineral producers and royalty owners (including oil, gas, coal, geothermal and uranium) to deduct a fixed percentage of gross income for large upfront expenditures from their corporate and personal income tax.
The tax deduction was first implemented in 1926, primarily to encourage oil and gas exploration. It allows eligible oil and gas producers and royalty owners to deduct some expenses associated with acquiring mineral rights and exploring for possible mineral deposits; development costs such as drilling; and costs for capital equipment such as pumps.
The allowance is available only to independent producers who produce fewer than 1,000 barrels per day and any related royalty owners; the deduction is 15 percent of gross income for oil, gas and oil shale. The amount deducted is limited to 100 percent of net income for oil and gas. Under this method, total deductions can exceed the capital invested to acquire and produce an oil or gas reserve. 8 The Congressional Research Service estimates that the oil and gas industry’s share of this exemption was $1 billion in 2006. 9 In addition, the Energy Policy Act of 1992 also allows independent oil and gas producers to take larger deductions against the alternative minimum tax for percentage depletion and intangible drilling costs, reducing the amount paid on income taxes by an unknown amount. 10
The Alternative Fuel Production Credit, implemented in 1980, applies to oil produced from shale and tar sands and natural gas produced from geopressured brine, Devonian shale, coal seams or biomass. In 2005, the Energy Production Act added some facilities that produce coke and coke gas to the production credit. In 2006, the credit was worth about $7.05 per barrel of oil-equivalent fuels. The credit has helped promote unconventional gas production and, after 2005, synthetic fuels produced from chemically altered coal. 11 Prior to the Energy Production Act, OMB estimated that the oil and gas industry would receive $890 million from this tax credit in 2006. 12
The Exemption from Passive Loss Limitation for Working Interest on Oil and Gas Property Credit exempts investors from federal passive loss limitation rules that limit the amounts that investors not actively involved in an enterprise in other industries are able to deduct. This benefit was worth $30 million in 2006. 13
Several smaller tax incentives also are dedicated to oil and gas, including: Natural Gas Distribution Pipelines Treated as 15-Year Property; Temporary 50 Percent Expensing for Equipment Used in the Refining of Liquid Fuels; and Amortization of All Geological and Geophysical Expenditures Over Two Years.
Many federal subsidies related to discovering or drilling for oil also subsidize natural gas, since a well may produce oil or gas or both. One tax subsidy specific to natural gas, however, is Natural Gas Distribution Pipelines Treated as 15-Year Property. This change in the Energy Policy Act of 2005 shortens the depreciation period to 15 years for any gas distribution lines first used after April 11, 2004 and before January 1, 2011. OMB estimated that this saved corporations $20 million in 2006. 14
Under the Temporary 50 Percent Expensing for Equipment Used in the Refining of Liquid Fuels tax deduction, producers of oil from shale and tar sands may expense 50 percent of the cost of refinery investments placed in service before January 1, 2012. These investments must increase the capacity of an existing refinery by at least 5 percent, or increase the volume of qualified fuels by at least 25 percent. OMB estimated that this deduction was worth $10 million in 2006. 15
The Amortization of All Geological and Geophysical Expenditures Over Two Years allows geological and geophysical expenditures incurred in connection with oil and gas exploration in the U.S. to be amortized over two years for independent oil companies and five years for certain major, integrated oil companies, a faster rate than expenses in other industries. OMB estimated the benefit to the oil and gas industry to be $10 million in 2006. 16
Federal Business Tax Subsidies Available to the Oil and Gas Industry
In addition to tax credits exclusive to the oil and gas industry, the federal government offers general tax incentives to business that some studies contend are particularly beneficial to oil and gas producers. These include the Accelerated Depreciation Allowance and the Foreign Tax Provisions Credit.
The Accelerated Depreciation Allowance greatly benefits the oil and gas industry because of its high capital costs. This tax provision allows business owners to take bigger deductions from corporate income tax in the first years after buying a business asset than would be available under general accounting principles. 17 OMB estimates that the subsidy provided by the accelerated depreciation of buildings (other than rental housing) and machinery and equipment totaled $35.5 billion in fiscal 2006 for all industries. 18
OMB has not separately estimated the effect of this provision on the oil and gas industry. A private study released in 1996, however, examined corporate tax records as well as statistical data and concluded that the petroleum industry accounted for almost 13 percent of this subsidy. However, since more recent and more detailed information is not available to confirm this relationship, the potential subsidy cannot be estimated, but is simply noted because of its large potential size.
The federal government taxes U.S. companies on their worldwide income. These companies receive a Foreign Tax Provisions Credit for taxes paid to other governments, to prevent double taxation. Income earned through controlled foreign corporations is not taxed in the U.S. until it returns home as dividends. In 1996, one IRS study found that in 1992, an average of 13 percent of large companies with foreign tax liabilities were associated with oil and gas. 19 For reasons similar to those stated above for the Accelerated Depreciation Allowance, this potential subsidy cannot be estimated but is simply noted due to its potential size.
Federal Royalty Subsidies
Oil and gas companies pay the federal government royalties to drill on federal lands. In 2005, federal and Native American lands supplied about 35 percent of the oil and 26 percent of the natural gas produced in the U.S. Oil and gas companies that lease these lands pay the U.S. Department of Interior’s Minerals Management Service (MMS) royalties based on a percentage of the cash value of the oil and natural gas produced and sold. In lieu of royalty payments, MMS may choose to accept crude oil, which is then either sold or placed in the nation’s Strategic Petroleum Reserve. 20
In 1995, Congress passed the Outer Continental Shelf Deep Water Royalty Relief Act of 1995, which authorized MMS to provide royalty relief on oil and gas produced in the deep waters of the Gulf of Mexico from leases issued from 1996 through 2000, a time when oil and gas prices were relatively low. MMS established that this royalty relief would be available only if oil and gas prices fell below certain levels for leases granted in 1996, 1997 and 2000. They did not, however, include this limitation for leases issued in 1998 and 1999.
MMS estimates that the federal government has lost $1 billion on leases granted in 1998 and 1999 for the seven-year period from 2000 to the end of 2006, or an estimated loss of about $143 million a year. 21
Federal Research and Development Spending
In 2006, Congress appropriated $64 million for Oil and Gas Research and Development by the Department of Energy (DOE). 22 Historically, most of this federal funding has gone to joint projects funded with federal, university and independent company funds intended to develop new reserves and extend the life of old ones. 23 Congress also appropriated $6.9 million for Oil Spill Research in the Department of Interior’s Minerals Management Service in 2006. 24
Federal Petroleum Reserve Subsidies
The federal government maintains three petroleum reserves, the Strategic Petroleum Reserve, Naval Petroleum and Oil Shale Reserves and the Northeast Home Heating Oil Reserve. These reserves are intended to provide the nation with emergency supplies of oil in the case of disruptions to commercial oil supplies. 25
The U.S. Strategic Petroleum Reserve, established after the 1973-74 oil embargo and currently managed by the U.S. Department of the Interior, consists of several storage sites created in deep underground salt caverns along the Texas and Louisiana Gulf Coast. The Energy Policy Act of 2005 directed the U.S. Secretary of Energy to fill the reserve to its authorized 1 billion-barrel capacity. Congress appropriated $207 million in 2006 to maintain these reserves. 26
The U.S. Department of Energy received $21 million in appropriations from Congress in 2006 to manage the Naval Petroleum and Oil Shale Reserves program. The Naval Petroleum Reserve is the Teapot Dome field in Casper, Wyoming, which is now a largely exhausted “stripper” field that serves as an oilfield technology-testing center. The U.S. Department of Energy is the lead office coordinating the creation and implementation of a commercial strategic fuel (oil shale and tar sands) development program for oil shale lands in Colorado, Utah and Wyoming. These oil shale lands are federal lands under the administration of the U.S. Department of Interior’s Bureau of Land Management. 27
The Northeast Home Heating Oil Reserve is a supply of emergency fuel oil for homes and businesses in the northeast U.S. that was established in 2000. Congress did not appropriate additional funds for this program in 2006. 28 Sales from the reserve financed the program in 2006. Current storage contracts are for two million barrels. 29
The total amount for all three petroleum reserve programs was over $228 million in 2006.
Various taxes represented approximately 87.4 percent of federal government subsidies for oil and gas in 2006 (Exhibit 28-10).
Exhibit 28-10
Estimated Federal Oil and Gas Subsidies in 2006
| Subsidy | Type | Amount |
|---|---|---|
| Expensing of Exploration and Development Costs Credit | taxes | $1,100,000,000 |
| Percentage Depletion Allowance | taxes | $1,000,000,000 |
| Alternative Fuel Production Credit | taxes | $890,000,000 |
| Exemption from Passive Loss Limitation for Working Interests in Oil and Gas Properties | taxes | $30,000,000 |
| Natural Gas Distribution Pipelines Treated as 15-Year Property | taxes | $20,000,000 |
| Temporary 50 percent Expensing for Equipment Used in the Refining of Liquid Fuels | taxes | $10,000,000 |
| Amortize all geological and geophysical expenditures over two years | taxes | $10,000,000 |
| Subtotal | $3,060,000,000 |
| Subsidy | Type | Amount |
|---|---|---|
| Accelerated Depreciation Allowance | taxes | N/A* |
| Foreign Tax Provisions Credit | taxes | N/A* |
| Subsidy | Type | Amount |
|---|---|---|
| U.S. Department of Interior, Oil and Gas Royalty Losses on 1998 and 1999 Gulf Oil and Gas Leases | access to natural resources | $142,857,143 |
| Subsidy | Type | Amount |
|---|---|---|
| U.S. Department of Energy, Oil and Gas Research and Development | direct spending | $64,350,000 |
| U.S. Department of Interior, Minerals Management Service Oil Spill Research | direct spending | $6,900,000 |
| Subtotal | $71,250,000 |
| Subsidy | Type | Amount |
|---|---|---|
| U.S. Department of Energy, Strategic Petroleum Reserve | direct spending | $207,340,000 |
| U.S. Department of Energy, Naval Petroleum and Oil Shale Reserves | direct spending | $21,285,000 |
| Subtotal | $228,625,000 | |
| Total | $3,502,732,143 |
*Cannot be estimated.
| Type of Subsidy | Percent of Total |
|---|---|
| Taxes | 87.4% |
| Government Ownership of Energy Production | 0.0% |
| Direct Spending | 8.6% |
| Access to Resources on Federal Lands | 4.1% |
| Liability/Risk Assumption | 0.0% |
| Tariffs | 0.0% |
Note: Numbers may not total due to rounding.
Source: Texas Comptroller of Public Accounts.
Texas State and Local Government Oil and Gas Subsidies
Texas state and local governments offered exemptions for the oil and gas industry and its consumers that totaled an estimated $1.4 billion in state fiscal 2006. The largest of these subsidies came in the form of incentives built into the state’s crude oil and natural gas severance taxes.
Texas Crude Oil Severance Tax Incentives
Exhibit 28-11
| Subsidies | Amount |
|---|---|
| Two-Year Inactive Wells | $46,135,868 |
| Three-Year Inactive Wells | $997,875 |
| Enhanced Oil Recovery projects | $45,647,759 |
| Co-production | $1,718,444 |
| Total | $94,499,946 |
Source: Texas Comptroller of Public Accounts.
This tax is imposed at a rate of 4.6 percent of the market value of crude oil produced in Texas. 30 Texas producers received a benefit from four incentives from this tax in 2006. The incentives – Two-Year Inactive Wells, Three-Year Inactive Wells, Enhanced Oil Recovery Projects and Co-production – produced a total of almost $94.5 million in subsidies in 2006 (Exhibit 28-11).
The Two-Year Inactive Wells program provides a 10-year incentive for oil and gas severance taxes from a well that the Texas Railroad Commission has certified as not producing oil for two years preceding the date of the application for certification; in other words, the incentive applies to dormant wells brought back into production. Wells qualifying for this incentive garnered over $46 million in exemptions in 2006. 31 A comparable Three-Year Inactive Wells program gave producers $997,875 in exemptions in 2006.
The Enhanced Oil Recovery Project provides a partial 10-year tax incentive from the date of certification by the Railroad Commission as an eligible oil field. Producers pay half the crude oil tax rate or 2.3 percent. This incentive saved producers $45.6 million in 2006. 32
The Co-production exemption provided a 10-year, 50 percent tax incentive for fields designated by the Railroad Commission as being enhanced oil recovery projects that permanently remove water from an oil or gas reservoir to obtain oil that could not otherwise be extracted. In fiscal 2006, the Co-production incentive provided over $1.7 million in subsidies. The incentive ended in fiscal 2007. 33
Texas Natural Gas Severance Tax Incentives
Exhibit 28-12
| Exemption | Amount |
|---|---|
| High-Cost Gas | $1,108,694,781 |
| Two-Year Inactive Wells | $55,829,144 |
| Three-Year Inactive Wells | $2,876,612 |
| Flared/Released Gas | $36,229 |
| Total 2006 | $1,167,436,766 |
Source: Texas Comptroller of Public Accounts.
Texas’ natural gas severance tax is imposed at a rate of 7.5 percent of the market value of gas produced and kept within the state. Texas allowed producers four incentives from this tax in 2006: High-Cost Gas, Two-Year Inactive Wells, Three-Year Inactive Wells and Flared/Released Gas. These gave producers a total of more than $1 billion in subsidies in 2006 (Exhibit 28-12).
The High-Cost Gas program provides a tax incentive for high-cost gas wells based on the ratio of each well’s drilling and completion costs to twice the median cost for all high-cost Texas gas wells submitted in the prior fiscal year. This exemption generated more than $1.1 billion in subsidies in 2006. 34
The Two-Year and Three-Year Inactive Wells programs for natural gas are similar to those for crude oil described in the section above. These provided producers with $58.7 million in incentives in 2006 from the natural gas tax.
The Flared/Released Gas program provides a lifetime incentive for gas produced from an oil well and brought to market gas that previously had been released into the air for 12 months or more. It generated just $36,229 in subsidies in 2006. 35
Texas Motor Fuels Tax
Exhibit 28-13
| Exemptions* | Amount |
|---|---|
| Federal government | $10,900,000 |
| Public schools | $4,400,000 |
| Sales between license holders | N/A** |
| Sales for export | N/A** |
| Aviation use | $5,600,000 |
| Fuel arriving in the tank of a motor vehicle (non-interstate trucker) | N/A* |
| Fuel lost by fire theft or accident | $3,500,000 |
| Marine use | $11,600,000 |
| Agricultural use | $9,800,000 |
| Construction use | $9,500,000 |
| Industry and commercial use | $24,400,000 |
| Transit company use | negligible |
| Electric & telephone cooperative use | $500,000 |
| Total | $80,200,000 |
*Exemptions do not include discounts related to tax collection by permit holders.
**Cannot be estimated.
Source: Texas Comptroller of Public Accounts.
Texas motor fuels tax includes tax exemptions, refunds and credits for both gasoline and diesel fuel. (Tax subsidies for biodiesel and ethanol are discussed in a later section.)
The gasoline tax is charged on each gallon of gasoline sold in Texas used to propel vehicles on Texas public roads. Exemptions include sales to exempt purchasers, such as the federal government, Texas public school districts and nonprofit electric and telephone cooperatives organized under the Texas Utilities Code. They also include exemptions for uses other than propelling a vehicle on Texas public roads, such as aviation, marine, agricultural, construction, industry and commercial and transit-company uses. Texas offered just over $80 million in these exemptions in 2006 (Exhibit 28-13). 36
Texas Diesel Subsidies
Texas’ Diesel Fuel Tax Exemptions are similar to those for gasoline, except that the state provides additional exemptions for railway engine use, scheduled intra-city bus routes and diesel fuel blends such as biodiesel and ethanol. The value of these exemptions cannot be estimated.
Franchise Tax Exemptions
In 2006, the Texas franchise tax provided tax credits worth an estimated $40 million to the oil and gas industry. The tax credits were primarily for investment, research and development and for job creation. The 79th Legislature, however, changed the franchise tax from a tax based on the greater of net earned surplus (federal taxable income with modifications) or net taxable capital (net worth) to a tax on taxable margins (total revenue minus either the cost of goods sold; the amount of compensation; or 30 percent of total revenue). 37
This change became effective for tax reports due after January 1, 2008, and will benefit oil and gas companies that subtract the cost of goods sold. In the oil and gas industry’s case, the cost of goods sold includes depreciation, depletion and amortization necessary for the production of goods. It also includes intangible drilling and “dry hole” costs (the cost of drilling wells that do not produce sellable oil or gas) as well as geological and geophysical costs incurred to identify and locate property with the potential to produce minerals. The change to this tax was not in effect in 2006 and therefore is not reflected in the estimate.
Under certain conditions, oil and gas producers now will be allowed to exclude certain oil and gas revenues from total revenue when they calculate their taxable margin. Those conditions are that the average monthly price of oil falls below $40 per barrel or the average closing price of gas is below $5 per 1 million Btus. The revenue excluded would be that derived from an oil well producing less than 10 barrels a day over a 90-day period or a gas well producing an average of less than 250,000 cubic feet (250 mcf) a day over a 90-day period.
Texas Local Property Tax Exemptions
Local governments may provide property tax incentives for the oil and gas industries. In 2006, Texas school districts reported the oil and gas industries’ property taxes were reduced by over $9.3 million in tax benefits as a result of Chapter 313 property value limitation agreements.
Under Chapter 312 of the Texas Tax Code, cities, counties and other taxing districts (except school districts) may provide Property Tax Abatements, which are agreements between a taxpayer and a taxing unit that exempt all or part of the increase in value of real property and/or tangible personal property from taxation for a period not to exceed ten years. 38 The Comptroller estimates that in 2006, the oil and gas industries claimed over $22.9 million in Chapter 312 property tax abatements.
In addition to these incentives, the Economic Development property tax refund provides state sales and use tax and franchise tax refunds to some Texas property owners for paying local school property taxes, subject to specific requirements, as defined in Sections 111.301 through 111.304 of the Texas Tax Code. If the total amount of all refunds claimed by property owners in any year exceeds $10 million, the Comptroller must reduce each claimant’s refund proportionally so that all property owners share in the $10 million. 39 Oil and gas industries were refunded over $3 million in 2006 through this incentive.
Exhibit 28-14 summarizes subsidies Texas state and local governments provided to the oil and gas industries in 2006, which totaled over $1.4 billion, and were comprised 100 percent of various taxes.
Exhibit 28-14
| Subsidy | Type | Amount |
|---|---|---|
| State Natural Gas Severance Tax Exemptions | taxes | $1,167,436,766 |
| State Crude Oil Severance Tax Exemptions | taxes | $94,499,946 |
| State Gasoline Tax Exemptions | taxes | $80,200,000 |
| State Franchise Tax Exemptions | taxes | $40,000,000 |
| Chapter 312 Property Tax Abatements (city, county and other property taxing districts) | taxes | $22,903,646 |
| Chapter 313 Property Value Limitations (school districts) | taxes | $9,304,108 |
| Economic Development Property Tax Refund | taxes | $3,089,871 |
| State Diesel Fuel Tax Exemptions | taxes | N/A* |
| Total | $1,417,434,337 |
*Cannot be estimated
| Type of Subsidy | Percent of Total Spending |
|---|---|
| Taxes | 100.0% |
| Homeowner Incentives | 0.0% |
| Direct Spending | 0.0% |
Source: Texas Comptroller of Public Accounts.
Detail: Coal Subsidies
Federal Coal Subsidies
The biggest tax subsidy for coal in 2006 was its share of the Alternative Fuel Production Credit, followed by its share of the Percentage Depletion Allowance and the Expensing of Exploration and Development Costs. (These taxes are described above in the section on oil and gas subsidies.) Other tax subsidies are specific to the coal industry, such as the Capital Gains Treatment for Coal Royalties and the Exemption of Government Payments to Disabled Coal Workers.
In 2005, Congress expanded the Alternative Fuel Production Credit to include a subsidy for firms that create synthetic fuel from chemically altered coal. 40 The synthetic fuel subsidy is nearly $3 per the equivalent of a barrel of oil for facilities that produce coke or coke gas. 41 After the 2005 legislation, OMB’s estimate of the value of this tax credit increased from $890 million to almost $3 billion in 2008. 42 This is the basis of the Comptroller’s estimate of coal’s share of this tax credit of $2.1 billion.
OMB valued Capital Gains Treatment for Coal Royalties at $160 million in 2006. 43 Owners of coal mining rights who lease their property usually receive royalties (payments from the companies mining the land). If the owners are individuals, they may be eligible to pay taxes on the royalties at a lower capital gains tax rate rather than at the higher individual income tax rate. 44
Coal producers can apply the Expensing of Exploration and Development Costs to the costs of surface mining and the construction of shafts and tunnels. 45 The Comptroller estimates coal’s share of this tax incentive to be $37 million in 2006.
The Comptroller estimates coal’s share of the Percentage Depletion Allowance to be $29.7 million in 2006. As described in the section on oil and gas subsidies above, the Percentage Depletion Allowance allows mineral producers and royalty owners to deduct 10 percent of their gross income up to a total equivalent to 50 percent of their net income to cover such capital costs as mine excavation. 46
Based on an estimate by the U.S. Joint Committee on Taxation, the Comptroller estimates that coal’s share of the Special Rules for Mining Reclamation Reserve cost the U.S. Treasury an estimated $12 million in 2006. This provision allows mining operators to deduct the cost of reclamation and closing. 47
The Exemption of Government Payments to Disabled Coal Workers from individual income taxes provides an additional tax incentive for certain members of the coal industry and cost the U.S. Treasury $50 million in 2006, according to OMB. Former coal miners who receive disability payments from the Black Lung Trust Fund do not have to pay income tax on them. 48
The coal subsidies do not include the federal Black Lung Disability Program or the U.S. Department of Labor’s Special Benefits to Disabled Coal Miners.
Finally, the USDA’s Rural Utilities Service provides loans to utilities; their 2006 budget provides $2.5 billion for such loans. In addition, Congress provided an additional $1 billion for rural electric utilities in recent Appropriation Acts. It is unknown how many of those loans were for coal-fired plants in 2006. 49 Thus, this subsidy cannot be estimated.
In 2007, conservation groups filed a lawsuit against a proposed coal-fired project, the Highwood Generating Station in Montana, to prevent the Rural Utilities Service from lending the project more than $600 million. 50
Various tax incentives represented the majority of coal subsidies in 2006 (Exhibit 28-15).
Exhibit 28-15
| Subsidy | Type | Amount |
|---|---|---|
| Alternative Fuel Production Credit (coal’s share) | taxes | $2,090,000,000 |
| U.S. Department of Energy, Coal Research and Development | direct spending | $376,198,000 |
| Capital Gains Treatment for Coal Royalties | taxes | $160,000,000 |
| Exemption of Payments to Disabled Coal Workers | taxes | $50,000,000 |
| Expensing of Exploration and Development Costs (coal’s share) | taxes | $37,010,000 |
| Percentage Depletion Allowance (coal’s share) | taxes | $29,700,000 |
| Special Rules for Mining Reclamation Reserves (coal’s share) | taxes | $12,000,000 |
| U.S. Department of Agriculture, Rural Utilities Service Loans for Coal-Fired Plants | direct spending | N/A* |
| Total | $2,754,908,000 |
*Cannot be estimated
| Type of Subsidy | Percent of Total Spending |
|---|---|
| Taxes | 86.3% |
| Government Ownership of Energy Production | 0.0% |
| Direct Spending | 13.7% |
| Access to Resources on Federal Lands | 0.0% |
| Liability/Risk Assumption | 0.0% |
| Tariffs | 0.0% |
Source: Texas Comptroller of Public Accounts.
Texas State and Local Government Coal Subsidies
Texas state government does not offer subsidies to the coal industry. Furthermore, while local governments may provide property tax exemptions for coal companies and school districts may provide property value limitations, neither were in effect in 2006 for any coal plants in Texas.
Detail: Nuclear Subsidies
Federal Nuclear Subsidies
In 2006, the U.S. nuclear industry received an estimated $1.2 billion in federal subsidies.
The U.S. Department of Energy administers a Non-Defense Environmental Cleanup program. This program provides for the cleanup and risk reduction of sites used for civilian energy research. Congress appropriated $349.7 million for this program in 2006. 51
The U.S. Department of Energy also has several nuclear energy research and development programs, including the Fusion Energy Research program, the Advanced Fuel Cycle Initiative, the Nuclear Power 2010 program, the Generation IV Nuclear Energy Systems program and the Nuclear Hydrogen Initiative.
The Fusion Energy Research program funds efforts at universities, private sector institutions and federal laboratories to develop fusion power. (Fusion is the energy source that powers the sun in which atoms of hydrogen fuse together to form helium in a very hot and highly charged gas or plasma.) Congress appropriated $280.7 million for this program in 2006. 52
The Advanced Fuel Cycle Initiative focuses on developing technologies that may reduce the amount and long-term toxicity of high-level waste from spent nuclear fuel. Congress appropriated $78.4 million for this program in 2006. 53
The Nuclear Power 2010 program focuses on ending technical, institutional and regulatory barriers to the deployment of new nuclear power plants. Congress appropriated $65.3 million for this program in 2006. 54
The Generation IV Nuclear Energy Systems Initiative is intended to develop the next-generation nuclear reactors and fuel cycles to make hydrogen possible. Congress appropriated $53.3 million for this program in 2006. 55
The Nuclear Hydrogen Initiative goal is to develop new technologies to generate hydrogen on a commercial scale in an environmentally safe manner. Congress appropriated $24.1 million for this program in 2006. 56
In addition to these initiatives, the Infrastructure Facilities Management program maintains and enhances national research facilities, including a series of national nuclear technology laboratories. Congress appropriated $149.2 million for this program in 2006. 57
The Tennessee Valley Authority is a federal corporation that sells power to utilities, industries and federal agencies at a cost below what most utilities would charge. 58 TVA can issue bonds and notes to generate capital expenditure funds, and can carry up to $30 billion in outstanding debt at any time. 59 In fact, TVA is one of only two federal agencies that can issue new debt, and held $26 billion in outstanding debt at the end of 2006. 60
A number of studies by the U.S. General Accounting Office have found that this high level of debt and debt service could place TVA at a competitive disadvantage if it were forced to compete on the open market with other utilities. 61 A substantial portion of this debt was generated when TVA built three nuclear plants. Construction delays, cost overruns and shutdowns of the nuclear plants meant that the plants could not produce electricity for sale, and TVA excluded the costs of the plants from its electricity rates for a long period. 62 Its current electricity rates are not sufficient to pay off the costs of these nuclear plants. 63 This study allocates a portion of this debt to nuclear subsidies to account for the debt attributed to nuclear power plants, amounting to a total of $186.3 billion in 2006.
The Comptroller estimates uranium’s share of the Percentage Depletion Allowance to be $0.5 million in 2006. As described in the section on oil and gas subsidies above, the Percentage Depletion Allowance allows uranium producers and royalty owners to deduct up to 22 percent of their gross income from mining, up to a total amount of 50 percent of net income. 64
The federal Price-Anderson Act of 1957 limits the liability of nuclear plant operators in the event of accidents, and establishes insurance requirements for them. Some sources say this represents an implied subsidy to commercial nuclear plant investors in the form of reduced insurance premiums, which lower their operating costs. 65 A recent GAO study, however, noted that no credible quantification of the Price-Anderson Act is available. 66 Thus this study does not estimate the amount of the subsidy.
Finally, the federal Energy Policy Act of 2005 provided the nuclear industry with financial incentives to build new nuclear power plants. The act provided, among other incentives, a production tax credit of 1.8 cents per kilowatt-hour for up to 6,000 megawatts of capacity from new, qualified advanced nuclear power facilities for eight years.67 None of these credits were claimed in 2006 because no nuclear plants came on line that year. The first application for a new reactor eligible for this incentive was submitted in September 2007, to expand the South Texas Project.
In all, direct spending represented the majority of federal government subsidies for nuclear energy in 2006 (Exhibit 28-16).
Exhibit 28-16
| Subsidy | Type | Amount |
|---|---|---|
| U.S. Department of Energy, Non-Defense Environmental Cleanup | direct spending | $349,687,000 |
| DOE Research and Development – Fusion Energy Research | direct spending | $280,683,000 |
| DOE Research and Development – Advanced Fuel Cycle Initiative | direct spending | $78,408,000 |
| DOE Research and Development – Nuclear Power 2010 | direct spending | $65,340,000 |
| DOE Research and Development – Generation IV Nuclear Energy Systems | direct spending | $53,263,000 |
| DOE Research and Development – Nuclear Hydrogen Initiative | direct spending | $24,057,000 |
| TVA Pricing Below What is Needed for Debt Service (nuclear-related) | government ownership | $186,300,000 |
| U.S. Department of Energy Infrastructure Facilities Management | direct spending | $149,188,000 |
| Percentage Depletion Allowance (uranium share) | taxes | $500,000 |
| Price-Anderson Act of 1957 | risk/liability | N/A* |
| Total | $1,187,426,000 |
*Cannot be estimated
| Type of Subsidy | Percent of Total Spending |
|---|---|
| Taxes | 0.04% |
| Government Ownership of Energy Production | 15.69% |
| Direct Spending | 84.27% |
| Access to Resources on Federal Lands | 0.00% |
| Liability/Risk Assumption | N/A* |
| Tariffs | 0.00% |
*Cannot be estimated
Source: Texas Comptroller of Public Accounts.
Texas State and Local Nuclear Subsidies
Texas state government does not offer subsidies to nuclear energy companies. While local governments may provide property tax exemptions for nuclear companies and school districts may provide property value limitations, neither were in effect in 2006 for any nuclear energy companies in Texas. The South Texas Project has, however, submitted an application for a Chapter 313 property value limitation to Palacios Independent School District for their nuclear energy project. If approved and implemented, their first year of the proposed qualifying time period would be 2012.
Spending on Renewable Energy
The Comptroller estimates that the U.S. spent over $132.5 billion to generate energy from renewable sources in 2006. As in the nonrenewable section, this estimate is taken at the time a consumer – either a homeowner or utility company – decides to purchase a type of fuel. Total spending on renewables including subsidies is estimated at $138.7 billion in 2006. Renewable subsidies comprised approximately $6.2 billion of that total.
Detail: Ethanol Subsidies
Federal Ethanol Subsidies
Federal ethanol subsidies are primarily federal tax credits. The largest credit, the Volumetric Ethanol Excise Tax Credit (VEETC), accounted for 54.6 percent of federal ethanol subsidies in 2006, or $2.6 billion. The VEETC represented 41.6 percent of 2006 federal subsidies for all renewables.
The American Jobs Creation Act of 2004 established the VEETC, which provides ethanol blenders or retailers with 51 cents per gallon of ethanol blended with gasoline, or (to phrase it in another way) $.0051 per percentage point of ethanol blended (i.e., E10 is eligible for $.051 per gallon; E85 is eligible for $.4335 per gallon). 68
The VEETC may be taken instead of the Alcohol Fuel Income Tax Credit, which also provides a 51 cent-per-gallon tax credit. The credit actually consists of the Alcohol Mixture Credit, the Alcohol Credit and the Small Producer Credit. 69 A producer of alcohol mixed with gasoline or other special fuel that either uses the fuel or sells it to others is eligible for the Alcohol Mixture Credit. Sellers or users of alcohol that is used as a fuel in a business or sold as fuel at retail qualify for the Alcohol Credit. Small ethanol producers — those that have a production capacity of 60 million gallons or less — that sell no more than 15 million gallons in the current year qualify for the Small Producer Credit. 70 The Alcohol Fuel Income Tax Credit totaled $50 million in 2006. 71
Second in importance is USDA’s Subsidies for Growing Corn. In 2006, 20 percent of the corn harvest went to ethanol production, and total agricultural subsidies through the Commodity Credit Corporation for corn in that year totaled $8.8 billion. 72 Thus, an estimated $1.8 billion went to subsidize corn destined for ethanol production.
The U.S. uses all of the ethanol it produces and imports some from other countries. Other countries that produce ethanol and import it into the U.S. may be subject to import tariffs or duties, depending on federal law or trade agreements. A general ad valorem tax of 2.5 percent is assessed on imports.
Two other trade policies affect imports. Some countries can import ethanol without a tariff as long as they import less than the amount set by the United States International Trade Commission – a quota that is set each year. In addition, a tax of 14.27 cents per liter, or 54 cents per gallon, is assessed on imports that are not exempt from the tariff or that exceed the limits allowed by other countries. Brazil, a large producer and exporter of ethanol, is subject to the tariff, thus the tariff is frequently called the Brazilian ethanol tariff. 73 The U.S. International Trade Commission has estimated that these assessments amounted to approximately $252.7 million in 2006. 74
However, some imported ethanol from Caribbean Basin Initiative (CBI) countries can enter the U.S. without paying duties, even if the ethanol was actually produced in a non-CBI country. Ethanol can be dehydrated in a CBI country, and then shipped to the U.S. to avoid the duty. 75 In addition, current law allows duties that are paid when ethanol is imported to be refunded if a related product, jet fuel, is exported. 76 This is called “duty drawback.” There are no data regarding the amounts subject to this drawback, 77 but there are tax proposals at the federal level to repeal the exemption for ethanol-related export refunds. To obtain the estimate for tariffs, this study used the U.S. International Trade Commission’s calculations minus the estimated tax saving of repealing the duty drawback for ethanol, for a total of $246.7 million. 78
The U.S. Department of Energy funds research to develop domestic biomass resources as energy sources. Biomass and biorefinery systems research focus on technological improvements to use biomass resources for fuels and power. The research effort funds ways to reduce the cost of harvesting and preparing biomass feedstocks, the chemical processes used to transform the feedstocks into various fuels or energy, and testing of biorefinery technologies to evaluate their performance. 79 Approximately 90 percent of the $89.8 million 2006 budget, or $80.8 million, is allocated to ethanol production. 80
Various taxes comprised the majority of federal subsidies for ethanol in 2006 (Exhibit 28-17).
Exhibit 28-17
| Subsidy | Type | Amount |
|---|---|---|
| Volumetric Ethanol Excise Tax Credit | taxes | $2,570,000,000 |
| U.S. Department of Agriculture, Agricultural Commodity Subsidies (corn) | direct spending | $1,760,800,000 |
| Tariff on Imports of Brazilian ethanol | tariff | $246,679,149 |
| U.S. Department of Energy, Biomass and Biorefinery Research and Development (ethanol-related) | direct spending | $80,798,400 |
| Alcohol Fuel Tax Credit | taxes | $50,000,000 |
| Total | $4,708,277,549 |
| Type of Subsidy | Percent of Total Spending |
|---|---|
| Taxes | 55.6% |
| Government Ownership of Energy Production | 0.0% |
| Direct Spending | 39.1% |
| Access to Resources on Federal Lands | 0.0% |
| Liability/Risk Assumption | 0.0% |
| Tariffs | 5.2% |
Note: Numbers may not total due to rounding.
Source: Texas Comptroller of Public Accounts.
Texas State and Local Ethanol Subsidies
Chapter 23 of the Texas Tax Code provides for a special property tax value for land used for agricultural purpose as well as land used for timber production. 81 This provides a subsidy to the extent that the land would be used to grow biomass that is used as fuel, such as in the production of ethanol or in firing biomass to produce electricity. However, exact data on land usage for fuel production is not collected, and thus this subsidy cannot be estimated.
Detail: Biodiesel Subsidies
Federal Biodiesel Subsidies
Most federal subsidies for biodiesel take the form of federal personal and corporate income or excise tax credits. Biodiesel benefits primarily from Biodiesel Tax Credits. These include the Biodiesel Credit, the Renewable Diesel Credit, the Biodiesel (or Agri-Biodiesel) Mixture Credit, the Renewable (or Agri-Biodiesel) Diesel Mixture Credit and the Small Agri-Biodiesel Producer Tax Credit. 82
These credits are based on the number of gallons used or produced. Each gallon of biodiesel, or bio-diesel used in a mixture, can qualify for an income tax credit of 50 cents per gallon. Biodiesel from “virgin” raw plant materials (agri-biodiesel) qualifies for a higher credit, $1 per gallon, as does non-virgin renewable diesel. Small agri-biodiesel producers — those that have a production capacity of 60 million gallons or less — that do not exceed 15 million gallons of production in a year qualify for a 10-cent per gallon income tax credit. 83 Biodiesel and small agri-biodiesel producers qualified for $90 million in tax credits for this purpose in 2006. 84
Section 1344 of the Energy Policy Act of 2005 extended the VEETC Excise Tax Credit for Biodiesel producers through 2008 (see the ethanol section for full discussion of VEETC). For biodiesel, the credits are $1 per gallon of agri-biodiesel and 50 cents per gallon for waste-grease biodiesel. If the fuel is used in a mixture, the credit amounts to one cent per percentage point of agri-biodiesel used or a half-cent per percentage point of waste-grease biodiesel. 85
The 2006 value of the VEETC for biodiesel is included in the amounts for biodiesel producer tax credits. 86
The federal U.S. Department of Agriculture’s Renewable Energy Systems and Energy Efficiency Improvements Program provides grants, loans and loan guarantees to farmers, ranchers or rural small businesses so that they can buy renewable energy systems and make energy efficiency upgrades. 87 These funds enable farmer and rural producers to expand the use of innovative renewable energy technologies in producing farm products. The 2006 awards helped to establish biodiesel plants in eight states. 88 For 2006, this study counted only the amount of direct grants as a subsidy, or $2.3 million for biodiesel. The amount of the interest rate between the government interest rate and the commercial rate would also count as a subsidy, but information was not available to calculate this difference.
The majority of federal subsidies for biodiesel were comprised of various taxes (Exhibit 28-18).
Exhibit 28-18
| Subsidy | Type | Amount |
|---|---|---|
| Biodiesel and Small Agri-biodiesel Producer Credit | taxes | $90,000,000 |
| U.S. Department of Agriculture, Renewable Energy Systems and Energy Efficiency (biodiesel-related) | direct spending | $2,315,835 |
| Total | $92,315,835 |
| Type of Subsidy | Percent of Total Spending |
|---|---|
| Taxes | 97.5% |
| Government Ownership of Energy Production | 0.0% |
| Direct Spending | 2.5% |
| Access to Resources on Federal Lands | 0.0% |
| Liability/Risk Assumption | 0.0% |
| Tariffs | 0.0% |
Source: Texas Comptroller of Public Accounts.
Texas State and Local Biodiesel Subsidies
The Texas Department of Agriculture administers the Fuel Ethanol and Biodiesel Production Incentive Program. Registered producers are charged a fee of 3.2 cents per gallon of fuel produced. The funds collected and matching general revenue funding may be appropriated for grants to producers as incentives to develop ethanol and biodiesel industries in Texas. 89 For 2006, nearly $2.1 million was distributed in incentive payments to biodiesel producers, while no funding was distributed to ethanol producers. This estimate counts only matching general revenue funding as the subsidy and omits fees charged to the industry. The last payments for the program were distributed in November 2007, and no appropriations were made by the 80th Legislature for the program to continue. 90
In 2006, the biodiesel industry claimed $10,943 in Chapter 312 Property Tax Abatements. Furthermore, although Chapter 313 property value limitations are available to the biodiesel industry, none were in effect in 2006.
Direct Spending represented the majority of state and local biodiesel subsidies in 2006 (Exhibit 28-19).
Exhibit 28-19
| Subsidy | Type | Amount |
|---|---|---|
| Texas Department of Agriculture, Fuel Ethanol and Biodiesel Production Incentive Program | direct spending | $2,096,477 |
| Chapter 312 Property Tax Abatements (city, county and other property taxing districts) | taxes | $10,943 |
| Total | $2,107,420 |
| Type of Subsidy | Percent of Total Spending |
|---|---|
| Taxes | 0.5% |
| Homeowner Incentives | 0.0% |
| Direct Spending | 99.5% |
Source: Texas Comptroller of Public Accounts.
Detail: Wind Subsidies
Federal Wind Subsidies
The more significant of the two main federal subsidies for wind energy is the New Technology Energy Tax Credit which applies to corporate and individual income taxes. This is a tax credit for producing and selling electricity produced from certain energy sources, including wind. Wind energy benefits most from this subsidy, compared to other energy sources due to the fact that much more electricity is generated from wind than by other resources eligible for the credit. In 2006, the credit was worth 1.9 cents per kilowatt-hour (kWh) of energy produced. A number of other renewable and some non-renewable energies also benefit from this tax credit. 91 Tax expenditure numbers from the U.S. Treasury combine two different sources of tax credits in the New Technology Tax Credit. The investment tax credit for solar and geothermal energy and the production tax credit for wind, biomass, small irrigation power, landfill gas, trash combustion and hydropower are counted in one tax expenditure number.92 This study allocates tax credits to the different energy sources based on recommendations from U.S. Treasury staff and the percentages that each renewable energy source contributed to total production in 2006.
Research and development funding at the U.S. Department of Energy contributed over $38.3 million to wind subsidies in 2006. The U.S. Department of Agriculture’s Renewable Energy Systems and Energy Efficiency programs accounted for approximately $5.1 million in federal subsidies to wind in 2006. For a full discussion of this program, see the listing under Biodiesel.
Governments and cooperative electrical companies can issue Clean Renewable Energy Bonds to help finance renewable energy projects. Since governmental or consumer-owned utilities do not benefit from income tax credits, tax credit bonds make financing for renewable energy projects affordable. Holders of the bonds receive a tax credit, instead of paying interest to the issuer. This makes financing available to the issuers, and the bond holders benefit at tax time. 93 In 2006, holders of bonds for wind energy benefited by an estimated $3.7 million in reduced taxes due to the tax credit for holding bonds.
In addition, the U.S. Department of Energy’s Renewable Energy Production Incentive program pays governmental and nonprofit electrical cooperatives for producing power using renewable energies, including wind. Facilities are paid per kilowatt hour, up to the amount allocated by federal appropriations. 94 Wind energy received an estimated $2.8 million from this program in 2006. A total of $4.8 million was distributed across all renewable energies in 2006. 95
Tax subsidies accounted for nearly 90 percent of federal wind subsidies in 2006 (Exhibit 28-20).
Exhibit 28-20
| Subsidy | Type | Amount |
|---|---|---|
| New Technology Energy Tax Credit (wind-related) | taxes | $408,000,000 |
| U.S. Department of Energy, Research and Development, Wind Energy | direct spending | $38,333,000 |
| U.S. Department of Agriculture, Renewable Energy Systems and Energy Efficiency (wind-related) | direct spending | $5,103,037 |
| Clean Renewable Energy Bonds (wind-related) | taxes | $3,672,131 |
| U.S. Department of Energy, Renewable Energy Production Incentive (wind-related) | direct spending | $2,816,121 |
| Total | $457,924,289 |
| Type of Subsidy | Percent of Total Spending |
|---|---|
| Taxes | 89.9% |
| Government Ownership of Energy Production | 0.0% |
| Direct Spending | 10.1% |
| Access to Resources on Federal Lands | 0.0% |
| Liability/Risk Assumption | 0.0% |
| Tariffs | 0.0% |
Source: Texas Comptroller of Public Accounts.
Texas State and Local Wind Subsidies
The Texas Tax Code provides a Solar and Wind-Powered Energy Devices Exemption on the amount of appraised property value arising from the installation or construction of a wind-powered or solar energy device. The device must produce energy for on-site use. Due to limitations with data collection, the amount of the subsidy for wind only cannot be estimated.
In 2006, the wind industry claimed approximately $1.3 million in tax benefits from Chapter 313 Property Value Limitations and more than $215,000 in Chapter 312 Property Tax Abatements.
Various taxes represented 100 percent of state and local subsidies for wind in 2006 (Exhibit 28-21).
Exhibit 28-21
| Subsidy | Type | Amount |
|---|---|---|
| Chapter 313 Property Value Limitations (school districts) | taxes | $1,293,600 |
| Chapter 312 Property Tax Abatements (city, county and other property taxing districts) | taxes | $215,200 |
| Solar and Wind-Powered Energy Devices School Property Tax Exemption (wind’s share) | taxes | N/A* |
| Total | $1,508,800 |
*Cannot be estimated
| Type of Subsidy | Percent of Total Spending |
|---|---|
| Taxes | 100.0% |
| Homeowner Incentives | 0.0% |
| Direct Spending | 0.0% |
Source: Texas Comptroller of Public Accounts.
Detail: Solar Subsidies
Federal Solar Subsidies
Research, Development, Test and Evaluation, Defense-Wide expenditures are the largest federal subsidies for solar energy. The U.S. Department of Defense (DOD) is the largest single funding source for the research and development of solar power. DOD has funded research on solar cells, solar thermal energy conversion, solar collection, solar thermal propulsion, high-efficiency solar photovoltaics, solar-powered ocean monitoring devices, novel solar cell configurations for battlefield deployment and high-altitude and long-endurance unmanned aircraft powered by solar energy. 96 DOD’s Defense Advanced Research Projects Agency funded approximately $274.8 million of research projects including solar energy in 2006. 97
DOE, Solar Energy Research and Development also contributed funding of $81.8 million to solar subsidies in 2006. 98
Three tax credits account for the remaining subsidies. The Residential Solar and Fuel Cell Tax Credit authorizes a 30 percent credit on personal income taxes for the purchase of solar electric, photovoltaic and solar water heating property. The credit includes the cost of installation up to $2,000 for solar electric or solar water heating property.99 In 2006, this tax credit amounted to $10 million. 100
The New Technology Energy Tax Credit was worth 1.9 cents per kWh of energy produced by solar power in 2006, for a total of $1.2 million. 101 See the section on wind subsidies for a full discussion of the New Technology Energy Tax Credit.
Clean Renewable Energy Tax Credit Bonds account for the remaining federal solar subsidies. See the section on Clean Renewable Energy Bonds under wind power for a full description of this subsidy. For 2006, the tax credit bonds saved taxpayers an estimated $14.2 million for solar energy projects.
The U.S. Department of Agriculture’s Renewable Energy Systems and Energy Efficiency program accounted for $0.7 million in federal subsidies to solar energy in 2006. For a full discussion of the program, see the listing under biodiesel subsidies.
Some mortgage programs regulated or supported by the U.S. government offer loans for efficiency upgrades including solar energy. For example, Fannie Mae (a congressionally chartered, shareholder-owned company and the nation’s largest source of home mortgage funds) offers an energy loan up to $15,000 for energy efficiency upgrades including solar water and space heating systems and photovoltaic systems. 102 FreddieMac (a congressionally chartered, shareholder-owned company that purchases mortgages from lenders) has similar energy efficiency programs. 103 The U.S. Department of Agriculture offers FarmerMac, a mortgage service for farmers similar to FreddieMac, through the Rural Housing Service. To the extent that government loans’ interest rates are below interest rates that may be obtained in the commercial market, this would constitute a subsidy. However, no information comparing government loan rates to commercial rates is available, therefore this subsidy cannot be estimated.
The U.S. Department of Agriculture Rural Development Electric Program makes several types of direct loans and loan guarantees to utilities serving rural customers. The purpose of the financing is to upgrade and expand the rural electric infrastructure.
Renewable energy programs may be financed through direct loans or guaranteed loans. In addition, a program for assistance to rural communities with extremely high energy costs distributes loans and grants for utility improvements in areas where the average residential energy cost is at least 275 percent of the national average. 104
For 2006, the total amount of loans and loan guarantees was $4.5 billion. 105 However, only the cost of the loans (interest rate) that is below what would be available commercially may be counted as a subsidy. Because the loans are made across multiple years, with differing interest rates, the exact cost of the subsidy for 2006 cannot be estimated. However, the General Accountability Office estimated the 2007 cost of the subsidy was $2.4 million. 106 In addition, because the loans are not specific to fuel source, the cost of the subsidy to renewable or non-renewable fuels cannot be estimated.
The Renewable Energy Production Incentive program, described under federal subsidies to wind, contributed a relatively minor subsidy to solar energy, totaling just more than $22,000 in 2006. 107
Direct spending comprised over 93.4 percent of federal subsidies for solar energy in 2006 (Exhibit 28-22).
Exhibit 28-22
| Subsidy | Type | Amount |
|---|---|---|
| U.S. Department of Defense, Research, Development, Test and Evaluation, Defense-Wide | direct spending | $274,773,000 |
| U.S. Department of Energy, Solar Energy Research and Development | direct spending | $81,791,000 |
| Clean Renewable Energy Bonds (solar-related) | taxes | $14,229,508 |
| Residential Solar and Fuel Cell Tax Credit | taxes | $10,000,000 |
| New Technology Energy Tax Credit (solar-related) | taxes | $1,222,274 |
| U.S. Department of Agriculture, Renewable Energy Systems & Energy Efficiency (solar-related) | direct spending | $718,396 |
| U.S. Department of Energy, Renewable Energy Production Incentive (solar-related) | direct spending | $22,140 |
| U.S. FreddieMac, FannieMae, FarmerMac (mortgage energy loan programs) | direct spending | N/A* |
| Total | $382,756,318 |
*Cannot be estimated
| Type of Subsidy | Percent of Total Spending |
|---|---|
| Taxes | 6.6% |
| Government Ownership of Energy Production | 0.0% |
| Direct Spending | 93.4% |
| Access to Resources on Federal Lands | 0.0% |
| Liability/Risk Assumption | 0.0% |
| Tariffs | 0.0% |
Source: Texas Comptroller of Public Accounts.
Texas State and Local Solar Subsidies
Texas law established a Franchise Tax Exemption for Solar Manufacturers and Deduction for Purchasers in 2006. This provision exempted businesses that engage exclusively in the business of manufacturing, selling or installing solar energy devices from the franchise tax. In addition, business taxpayers were able to deduct 10 percent of the amortized cost of solar energy equipment or equipment used in a clean coal project from the base of the franchise tax or, alternatively, to deduct the cost of the system from the company’s taxable capital. As noted above, in 2006 the franchise tax base was earned surplus or capital. 108
Beginning with reports due after January 1, 2008, the franchise tax base will be the taxable margin on total revenue minus either cost of goods sold or compensation. The exemption for solar equipment producers will continue under the new tax base. Purchasers will continue to be able to deduct 10 percent of the cost. The Comptroller estimates the value of both exemptions at about $500,000 per year.
Texas provides a Solar and Wind-Powered Energy Devices School Property Tax Exemption, previously described in the section on wind subsidies; however, due to limitations with data collection, the amount of the subsidy for solar only cannot be estimated.
A few Texas utilities offer subsidies for the purchase or lease of solar energy devices. Austin Energy offers a rebate program for the purchase and installation of photovoltaics. 109 In 2006, Austin Energy rebated nearly $2.1 million back to its residential customers through this program. 110 The Austin Energy Utility Rebate for Solar Water Heating Program provides a similar rebate for solar water heaters, although no rebates were granted to customers in 2006.111
Such subsidies are not limited to urban areas. Big Country Electric Coop in Roby, Texas offers solar water pumping systems to its members. These systems deliver livestock water where electrical power is unavailable or uneconomical. The systems sell for about $2,750, or can be leased for $50 per month over a 60-month term. Each standard system uses two 75-watt DC solar panels. Thus far, co-op members have obtained about 50 of these systems. 112 Big Country does not keep data on the cost of this program, however, so its dollar value cannot be estimated. 113
Most rebates offered by Texas utilities are for energy efficiency programs and are not fuel-specific. These are discussed in the chapter on energy efficiency.
Homeowner incentives accounted for over 80 percent of state and local subsidies for solar in 2006 (Exhibit 28-23).
Exhibit 28-23
| Subsidy | Type | Amount |
|---|---|---|
| Austin Energy Utility Rebate for Solar Photovoltaic Program | homeowner incentives | $2,074,101 |
| State Franchise Tax Exemption for Solar Manufacturers and Deduction for Purchasers | taxes | $500,000 |
| Austin Energy Utility Rebate for Solar Water Heating Program | homeowner incentives | 0* |
| Solar and Wind-Powered Energy Devices School Property Tax Exemption (solar’s share) | taxes | N/A** |
| Big Country Electric Coop Photovoltaic Water Pump Sales & Lease Program | homeowner incentives | N/A** |
| Total | $2,574,101 |
*No program participants in 2006
**Cannot be estimated
| Type of Subsidy | Percent of Total Spending |
|---|---|
| Taxes | 19.4% |
| Homeowner Incentives | 80.6% |
| Direct Spending | 0.0% |
Source: Texas Comptroller of Public Accounts.
Detail: Hydroelectric Power Subsidies
Federal Hydroelectric Power Subsidies
Energy produced by hydroelectric power receives its main federal subsidies through government ownership. The federal government owns and operates entities such as the Tennessee Valley Authority (TVA) and four power marketing administrations that produce electricity for sale to consumers, industries and businesses. 114 Government ownership allows electricity to be sold below market price or to omit cost elements such as debt service.
Three power marketing administrations, the Western Area Power Administration, the Southwestern Power Administration and the Southeastern Power Administration, sell power to consumers below the rates that commercial utilities would charge. 115 They can charge lower rates because they do not have to pay high costs for fuel; the cost of producing electricity from hydroelectric power is low. In addition, their original construction financing interest rates were favorable, since they were generally set at 1930s and 1940s rates. Even for new construction projects, these administrations have been allowed to pay interest at below-market rates, even though the U.S. Treasury, which financed the projects, has to pay long-term interest rates above the administrations’ rate payments. This amounts to a subsidy to the production of hydroelectric power. 116 For 2006, this subsidy amounted to $160 million. 117
TVA, the federal corporation that sells power to utilities, industries and federal agencies, can issue debt to fund operations and capital expenditures (see the nuclear section for a full discussion of this subsidy). This study allocates a portion of this debt to nuclear subsidies to account for the debt attributed to nuclear power plants, leaving $83.7 million attributed to hydroelectric power subsidies in 2006.
Hydroelectric power also benefits from the New Technology Energy Tax Credit which supplies a federal income tax credit for incremental amounts of electricity produced from improved energy efficiency or increases in capacity to existing hydroelectric power plants. For hydroelectric power, the credit is one half of the specified rate, or about 9 cents per kWh of electricity generated. Plants can claim the credit for ten years, beginning on the date upon which the improvement was placed into service. 118 For 2006, hydroelectric power benefited from an estimated $50.6 million in federal subsidies from the New Technology Energy Tax Credit.
Research and development funding at DOE was a relatively minor contributor to hydroelectric power subsidies in 2006, amounting to less than $0.5 million.
Bond holders of Clean Energy Renewable Bonds benefited by an estimated $0.5 million in 2006 tax credits (see Wind for a full discussion).
Government ownership represented over 82 percent of federal subsidies for hydroelectric power in 2006 (See Exhibit 28-24).
Exhibit 28-24
| Subsidy | Type | Amount |
|---|---|---|
| U.S. Department of Energy, Power Marketing Administration Below Market Pricing of Power | government ownership | $160,000,000 |
| TVA Pricing Below What is Needed for Debt Service (hydroelectric power-related) | government ownership | $83,700,000 |
| New Technology Energy Tax Credit (hydroelectric power-related) | taxes | $50,580,592 |
| U.S. Department of Energy, Hydroelectric Power Research and Development | direct spending | $495,000 |
| Clean Renewable Energy Bonds (hydroelectric power-related) | taxes | $459,016 |
| Total | $295,234,608 |
| Type of Subsidy | Percent of Total Spending |
|---|---|
| Taxes | 17.3% |
| Government Ownership of Energy Production | 82.5% |
| Direct Spending | 0.2% |
| Access to Resources on Federal Lands | 0.0% |
| Liability/Risk Assumption | 0.0% |
| Tariffs | 0.0% |
Source: Texas Comptroller of Public Accounts.
Texas State and Local Hydroelectric Power Subsidies
No state or local subsidies for hydroelectric power were claimed in Texas in 2006.
Detail: Biomass Subsidies
Federal Biomass Subsidies
Biomass encompasses a broad array of different energy sources. The most economically significant of these, which also accounts for the largest federal subsidies, is wood. Wood-derived biomass energy accounts for an estimated 93.2 percent or about $195.4 million of all federal subsidies for biomass (Exhibit 28-25).
Current tax rules allow timber producers to deduct most of the costs of maintaining timber at the time those costs are incurred. These costs include property taxes, interest, insurance and labor and materials devoted to removing unwanted trees and controlling fire, disease and insects. Other industries must apply capitalization rules that prohibit production costs from being deducted until goods or services are actually sold. The net effect of Expensing of Multi-Period Timber-Growing Costs lowers the effective tax rate on timber. 119 For 2006, the portion of timber that was used as fuel earned a subsidy of $52.2 million.
When landowners sell lumber, proceeds of the sale can be counted as capital gains for income tax purposes, under certain circumstances. If the landowner does not apply capital gains rules, the proceeds are taxed at regular income rates of up to 35 percent. In addition, the landowner would have to pay an additional 15.3 percent self-employment tax because this category of income is considered self-employment. By using capital gains treatment for this income, landowners can limit taxable liability to the profit or gain from the sale, minus any selling costs and the basis of the timber costs. To take Capital Gains Tax Treatment of Lumber Income, the landowner must have owned the property for more than a year. 120 For 2006, the portion of timber that was used as fuel earned a subsidy of $28.8 million.
The Reforestation Amortization and Tax Credit allows landowners to deduct most of their reforestation expenses from their taxable income over an eight-year period (amortization) and to receive a direct tax credit of 10 percent of their reforestation expenses. 121 For 2006, the portion of timber that was used as fuel earned a subsidy of $54 million.
The U. S. Forest Service sells timber from national forests. In recent years, the U.S. Forest Service has spent more on timber programs than it has collected from the sales of timber. The difference between the expenditures and sales revenues amounts to a subsidy of the cost of timber. Only the percent of timber estimated to be used as fuel is counted in Forest Service Losses and Timber Sales. For 2006, this amounted to $23.4 million in federal subsidies.
Direct spending for biomass comes from the U.S. Department of Agriculture’s Renewable Energy Systems and Energy Efficiency program (described in biodiesel) and in the Renewable Energy Production Incentive program, described under federal subsidies to wind. Together, both sources contributed approximately $5.5 million in subsidies to biomass energy in 2006. 122
Various taxes accounted for the majority of federal subsidies for biomass in 2006 (Exhibit 28-25).
Exhibit 28-25
| Subsidy | Type | Amount |
|---|---|---|
| Amortization and Expensing of Reforestation Expenditures* | taxes | $54,000,000 |
| Expensing Multi-Period Timber Growing Costs* | taxes | $52,200,000 |
| New Technology Energy Tax Credit (biomass-related) | taxes | $44,085,760 |
| Capital Gains Treatment of Certain Lumber Income* | taxes | $28,800,000 |
| U.S. Department of Agriculture, Forest Service Losses, Timber Sales, and Fuel Wood Fraction* | access to natural resources | $23,400,000 |
| U.S. Department of Agriculture, Renewable Energy Systems and Energy Efficiency (biomass-related) | direct spending | $3,589,232 |
| U.S. Department of Energy, Renewable Energy Production Incentive (biomass-related) | direct spending | $1,960,325 |
| Clean Renewable Energy Bonds (biomass-related) | taxes | $1,606,558 |
| Total | $209,641,875 |
* Portion of biomass used as fuel
| Type of Subsidy | Percent of Total Spending |
|---|---|
| Taxes | 86.2% |
| Government Ownership of Energy Production | 0.0% |
| Direct Spending | 2.6% |
| Access to Resources on Federal Lands | 11.2% |
| Liability/Risk Assumption | 0.0% |
| Tariffs | 0.0% |
Source: Texas Comptroller of Public Accounts.
Texas State and Local Biomass Subsidies
Chapter 312 and Chapter 313 incentives (as previously described) are available to companies in the biomass industry, but none were claimed in 2006.
Detail: Geothermal Subsidies
Federal Geothermal Subsidies
Geothermal energy benefits from the Geothermal Technologies Research and Development program at the U. S. Department of Energy. The program funds activities to develop geothermal resources, develop technologies to enhance the productivity and lifespan of engineered geothermal reservoirs, conduct research on drilling and to enhance the deployment of technologies from research to active use. 123 In 2007, the U.S. Department of Energy received $22.8 million for the program. 124 The New Technology Energy Tax Credit accounted for $6.1 million and direct spending to farmers and rural businesses under the Renewable Energy Systems and Energy Efficiency program amounted to just over $285,000.
Direct spending represented the majority of federal subsidies for geothermal energy in 2006 (Exhibit 28-26).
Exhibit 28-26
| Subsidy | Type | Amount |
|---|---|---|
| U.S. Department of Energy, Research and Development (geothermal-related) | direct spending | $22,762,000 |
| New Technology Energy Tax Credit (geothermal-related) | taxes | $6,111,372 |
| U.S. Department of Agriculture, Renewable Energy Systems and Energy Efficiency (geothermal-related) | direct spending | $285,162 |
| Total | $29,158,534 |
| Type of Subsidy | Percent of Total Spending |
|---|---|
| Taxes | 21.0% |
| Government Ownership of Energy Production | 0.0% |
| Direct Spending | 79.0% |
| Access to Resources on Federal Lands | 0.0% |
| Liability/Risk Assumption | 0.0% |
| Tariffs | 0.0% |
Source: Texas Comptroller of Public Accounts.
Texas State and Local Geothermal Subsidies
The following Texas utilities provide rebate subsidies for geothermal heat pumps: CenterPoint Energy, College Station Utilities, Denton Municipal Electric, Farmers Electric Cooperative and United Cooperative Services. The rebate offered may be a fixed amount, an amount based on the efficiency rating of the heat pump, an amount given per ton of the heat pump or an amount based on the demand and energy savings at a specified rate. In 2006, these utilities returned $45,400 in rebates to their residential customers (Exhibit 28-27). 125
Homeowner incentives accounted for 100 percent of state and local subsidies for geothermal energy in 2006 (Exhibit 28-27).
Exhibit 28-27
| Subsidy | Type | Amount |
|---|---|---|
| Farmers Electric Cooperative Residential/Agricultural Energy Efficiency Rebate Program (geothermal heat pumps) | homeowner incentives | $24,900 |
| Denton Municipal Electric EnergySave Rebate Program (geothermal heat pumps) | homeowner incentives | $17,500 |
| United Cooperative Services Residential Energy Efficiency Rebate Program (geothermal heat pumps) | homeowner incentives | $3,000 |
| CenterPoint Energy Commercial and Industrial Standard Offer Program (geothermal heat pumps) | homeowner incentives | 0 |
| College Station Utilities Residential Energy Back II Rebate Program (geothermal heat pumps) | homeowner incentives | 0 |
| Total | $45,400 |
| Type of Subsidy | Percent of Total Spending |
|---|---|
| Taxes | 0.0% |
| Homeowner Incentives | 100.0% |
| Direct Spending | 0.0% |
Conclusion
This chapter estimates the federal, state and local energy governmental subsidies that Texans supported in 2006. It provides a snapshot of the relative percent of subsidies for each type of fuel and a description of the different types of subsidies for each fuel.
Financial subsidies to the energy sector have been used to support the development or extraction of energy resources, in some cases helping to create new businesses or whole industries. Favorable tax treatment, direct government spending including research and development, government ownership, access to natural resources, and favorable tariff policies all played important roles in 2006.
These subsidies are being directed to renewable energy-producing resources in addition to more traditional oil, gas and coal industries. Ethanol production, for example, benefited from tax credits, agricultural subsidies, trade policies and direct spending in 2006. One-fifth of the nation’s corn crop in 2006 was directed to ethanol production – no doubt the entire price of corn, including subsidies, affected farmers’ planting decisions. In Texas and other states, the growth of the wind industry has been spurred by federal tax credits, direct federal spending and local property tax subsidies. Non-financial factors, as discussed in each energy source, also can play important roles in developing energy resources such as Texas’ natural opportunity for wind resources as well as a policy of building transmission capacity.
Each financial subsidy entails costs to Texas consumers, who are also taxpayers. As policy makers consider energy policy in the coming years, this chapter is intended to help them identify federal, state and local government financial subsidies. This, combined with the fuel source analyses of earlier chapters in this report, can aid decision makers in weighing potential consequences of governmental policies.
Endnotes
- 1 U.S. Energy Information Administration, Federal Financial Interventions and Subsidies in Energy Markets 1999: Primary Energy (Washington, D.C., September 1999), p. 1. and Appendix E, http://www.eia.doe.gov/oiaf/servicerpt/subsidy/pdf/sroiaf(99)03.pdf. (Last visited April 24, 2008.)
- 2 Robert H. Bezdek and Robert M. Wendling, “A Half Century of US Federal Government Energy Incentives: Value, Distribution and Policy Implications,” International Journal Global Energy Issues (Vol. 27, No. 1, 2007), pp. 42-60.
- 3 U.S. Department of Energy, Energy Information Administration, Federal Financial Interventions and Subsidies in Energy Markets 1999: Energy Transformation and End Use , (Washington, D.C., May 2000), p. 7. http://www.eia.doe.gov/oiaf/servicerpt/subsidy1/pdf/sroiaf(2000)02.pdf. (Last visited April 24, 2008.)
- 4 U.S. Department of Energy, Energy Information Administration, Federal Financial Interventions and Subsidies in Energy Markets 1999: Primary Energy , (Washington, D.C., May 2000), p. 50. http://www.eia.doe.gov/oiaf/servicerpt/subsidy/pdf/sroiaf(99)03.pdf. (Last visited April 24, 2008.)
- 5 Texas Comptroller of Public Accounts, “Appraised Value Limitation and Tax Credit”, http://www.window.state.tx.us/taxinfo/proptax/hb1200/index.html. (Last visited April 24, 2008.)
- 6 Texas H.B. 2994, 80th Leg., Reg. Sess. (2007), requires the Comptroller to report on the progress of all Chapter 313 agreements, http://www.legis.state.tx.us/tlodocs/80R/billtext/pdf/HB02994F.pdf. (Last visited April 24, 2008); Texas H.B. 3430, 80th Leg., Reg. Sess. (2007), requires the Comptroller to report on the progress of all Chapter 313 agreements, http://www.legis.state.tx.us/tlodocs/80R/billtext/pdf/HB03430F.pdf. (Last visited April 24, 2008); and Texas H.B. 3693, 80th Leg., Reg. Sess. (2007), requires the Comptroller to report on the progress of certain Chapter 313 projects.http://www.legis.state.tx.us/tlodocs/80R/billtext/pdf/HB03693F.pdf. (Last visited April 24, 2008.)
- 7 Congressional Research Service, Oil and Gas Tax Subsidies: Current Status and Analysis , by Salvatore Lazzari (Washington. D.C., February 27, 2007), pp. 6 & 17, http://www.ncseonline.org/NLE/CRSreports/07March/RL33763.pdf. (Last visited April 24, 2008.)
- 8 Congressional Research Service, Oil and Gas Tax Subsidies: Current Status and Analysis, p. 7.
- 9 Congressional Research Service, Oil and Gas Tax Subsidies: Current Status and Analysis, p. 17.
- 10 U.S. Department of the Treasury, “Statement of the Office of Tax Policy Department of the Treasury Before the Subcommittee on Select Revenue Measures Committee on Ways and Means,” June 14, 2001, http://www.treas.gov/press/releases/po424.htm. (Last visited April 24, 2008.)
- 11 The Brookings Institution, Eliminating Tax Expenditures with Adverse Environmental Effects , by Eric Toder (Washington D.C., June 2007), p. 6, http://pdf.wri.org/Brookings-WRI_TaxExpenditures.pdf. (Last visited April 24, 2008.)
- 12 U.S. Office of Management and Budget, Analytical Perspectives: Budget of the United States Government Fiscal Year 2005 (Washington, D.C., 2004), p. 287, http://www.whitehouse.gov/omb/budget/fy2005/pdf/spec.pdf. (Last visited April 24, 2008.)
- 13 U.S. Office of Management and Budget, Analytical Perspectives: Budget of the United States Government, Fiscal Year 2008 (Washington, D.C., 2007), p. 291, http://www.whitehouse.gov/omb/budget/fy2008/pdf/spec.pdf. (Last visited April 24, 2008.)
- 14 U.S. Office of Management and Budget, Analytical Perspectives: Budget of the United States Government, Fiscal Year 2008 (Washington, D.C., 2007), p. 302, http://www.whitehouse.gov/omb/budget/fy2008/pdf/spec.pdf. (Last visited April 24, 2008.)
- 15 U.S. Office of Management and Budget, Analytical Perspectives: Budget of the United States Government, Fiscal Year 2008 , p. 291. http://www.whitehouse.gov/omb/budget/fy2008/pdf/spec.pdf. (Last visited April 24, 2008.)
- 16 U.S. Office of Management and Budget, Analytical Perspectives: Budget of the United States Government, Fiscal Year 2008 , p. 291. http://www.whitehouse.gov/omb/budget/fy2008/pdf/spec.pdf. (Last visited April 24, 2008.)
- 17 Congressional Research Service, Oil and Gas Tax Subsidies: Current Status and Analysis, p. 17.
- 18 U.S. Office of Management and Budget, Analytical Perspectives: Budget of the United States Government, Fiscal Year 2008 , p. 291. http://www.whitehouse.gov/omb/budget/fy2008/pdf/spec.pdf. (Last visited April 24, 2008.)
- 19 Internal Revenue Service, SOI Bulletin: A Quarterly Statistics of Income Report, “Controlled Foreign Corporations, 1992” by Katheryn A. Green, Winter 1995-1996, pp. 93-104.
- 20 U.S. Government Accountability Office, Royalty Revenues (Washington, D.C., June 21, 2006), pp. 1, 5 and 7, www.gao.gov/new.items/d06786r.pdf. (Last visited April 24, 2008.)
- 21 U.S. Government Accountability Office, Oil and Gas Royalties (Washington, D.C., April 12, 2007), pp. 1-5, www.gao.gov/new.items/d07590r.pdf. (Last visited April 24, 2008.)
- 22 U.S. Department of Energy, “FY 2007 Control Table by Appropriation”, http://www.cfo.doe.gov/budget/07budget/Content/appropcontrol.pdf. (Last visited April 24, 2008.)
- 23 American Association of Petroleum Geologists, “Department of Energy 2007 Budget Request for Oil and Natural Gas Research and Development”, http://dpa.aapg.org/testimonies/2006/02_06rose.cfm. (Last visited April 24, 2008.)
- 24 Congressional Research Service, Interior, Environment, and Related Agencies: FY2008 Appropriations , CRS Report for Congress, Order Code RL34011, May 21, 2007, p. 20, http://opencrs.cdt.org/document/RL34011. (Last visited April 24, 2008.)
- 25 U.S. Department of Energy, “U.S. Petroleum Reserves”, http://www.fossil.energy.gov/programs/reserves/. (Last visited April 24, 2008.)
- 26 U.S. Department of Energy, “FY 2007 Control Table by Appropriation”, http://www.cfo.doe.gov/budget/07budget/content/appropcontrol.pdf. (Last visited April 24, 2008.)
- 27 U.S. Department of Energy, “Naval Petroleum Reserves: Profile”, http://www.fossil.energy.gov/programs/reserves/npr/index.html. (Last visited April 24, 2008.)
- 28 U.S. Department of Energy, “FY 2007 Control Table by Appropriation”, http://www.cfo.doe.gov/budget/07budget/content/appropcontrol.pdf. (Last visited April 24, 2008.)
- 29 U.S. Department of Energy, “Northeast Home Heating Oil Reserve – Profile”, http://www.fossil.energy.gov/programs/reserves/heatingoil/index.html. (Last visited April 24, 2008.)
- 30 Texas Comptroller of Public Accounts, “Crude Oil Production Tax”. http://itd.cpa.state.tx.us/taxpolicy/New%20Web/MASTER%20FILE%20WEB%20SITE/Fees%20Crude%20Oild%20Prod%20Tax.htm. (Last visited April 24, 2008.)
- 31 Texas Comptroller of Public Accounts, “Crude Oil Production Tax,” (Austin, Texas), pp. 131-132, http://www.window.state.tx.us/taxinfo/taxpubs/taxpubs.html, (Under “Minerals Tax” heading publication number 96-161), (Last visited April 24, 2008.)
- 32 Texas Comptroller of Public Accounts, “Crude Oil Tax Guide,” March 2003, (Austin, Texas), pp. 126-128, http://www.window.state.tx.us/taxinfo/taxpubs/taxpubs.html, (Under “Minerals Tax” heading publication number 96-161), (Last visited April 24, 2008.)
- 33 Texas Comptroller of Public Accounts, “Crude Oil Tax Guide,” March 2003, (Austin, Texas), pp. 126-128, http://www.window.state.tx.us/taxinfo/taxpubs/taxpubs.html, (Under “Minerals Tax” heading publication number 96-161), (Last visited January 22, 2008.); Golder Associates, “Description of the Yates Field,” http://www.fracturedreservoirs.com/niper/FIELDHIS.HTM. (Last visited April 24, 2008.)
- 34 Texas Comptroller of Public Accounts, “Natural Gas Tax Guide,” June 2004, (Austin, Texas), p. 126-128, http://www.window.state.tx.us/taxinfo/taxpubs/taxpubs.html, (Under” Minerals Tax” heading publication number 96-203), (Last visited April 24, 2008.)
- 35 Texas Comptroller of Public Accounts, Tax Exemptions & Tax Incidence (Austin, Texas, February 2007), pp. 33-34, http://www.window.state.tx.us/taxinfo/incidence07/incidence07.pdf. (Last visited April 24, 2008.)
- 36 Texas Comptroller of Public Accounts, Tax Exemptions & Tax Incidence , p. 29; and Texas Comptroller of Public Accounts, “Gasoline Tax,” http://www.window.state.tx.us/taxinfo/incidence/table31.html. (Last visited April 24, 2008.)
- 37 Texas Comptroller of Public Accounts, Special Report, Franchise Tax Credit Claims Under SB 441, March 2007. http://www.window.state.tx.us/specialrpt/sb441_07/report.html (Last visited April 24, 2008.)
- 38 Texas Comptroller of Public Accounts, “Tax-Related State and Local Economic Development Programs, February 2006”, http://window.state.tx.us/specialrpt/stateloc05/. (Last visited April 24, 2008.)
- 39 Texas Comptroller of Public Accounts, “Refund for Economic Development”, http://www.window.state.tx.us/taxinfo/proptax/registry06/refund.html. (Last visited April 24, 2008.)
- 40 U.S. Internal Revenue Service, “Energy Tax Policy Act of 2005 P.L. 109-58” (Washington, D.C.), http://www.irs.gov/taxexemptbond/article/0,,id=155666,00.html. (Last visited April 24, 2008.)
- 41 U.S. Internal Revenue Service Bulletin, “Notice 2007-38”, April 30, 2007, pp. 1-2.
- 42 U.S. Office of Management and Budget, Analytical Perspectives: Budget of the United States Government, Fiscal Year 2008 , p. 287, http://www.whitehouse.gov/omb/budget/fy2008/pdf/spec.pdf. (Last visited April 24, 2008.)
- 43 U.S. Office of Management and Budget, Analytical Perspectives: Budget of the United States Government, 2008 , p. 291, http://www.whitehouse.gov/omb/budget/fy2008/pdf/spec.pdf. (Last visited April 24, 2008.)
- 44 U.S. Energy Information Administration, Federal Financial Interventions and Subsidies in Energy Markets 1999: Primary Energy (Washington, D.C., September 1999), Appendix B, p. 62, http://www.eia.doe.gov/oiaf/servicerpt/subsidy/pdf/sroiaf(99)03.pdf. (Last visited April 24, 2008.)
- 45 U.S. Office of Management and Budget, Analytical Perspectives: Budget of the United States Government, 2008 , p. 301, http://www.whitehouse.gov/omb/budget/fy2008/pdf/spec.pdf. (Last visited April 24, 2008.)
- 46 U.S. Office of Management and Budget, Analytical Perspectives: Budget of the United States Government, 2008 , p. 301, http://www.whitehouse.gov/omb/budget/fy2008/pdf/spec.pdf. (Last visited April 24, 2008.)
- 47 Joint Committee on Taxation, Estimates of Federal Tax Expenditures for Fiscal Years 2006-2010 (Washington, D.C., April 25, 2006), p. 32, http://www.house.gov/jct/s-2-06.pdf. (Last visited April 24, 2008.)
- 48 U.S. Office of Management and Budget, Analytical Perspectives: Budget of the United States Government, 2008 , p. 291, http://www.whitehouse.gov/omb/budget/fy2008/pdf/spec.pdf. (Last visited April 24, 2008.)
- 49 U.S. Department of Agriculture, “Rural Development”, http://www.usda.gov/agency/obpa/Budget-Summary/2006/07.RD.htm. (Last visited April 24, 2008.)
- 50 Richard Ecke, “Environmental Lawsuit Aims to Block Coal-Fired Plant Funding,” Great Falls Tribune (July 24, 2007), Section A, p. 1A.
- 51 U.S. Department of Energy, FY 2008 DOE Budget Request to Congress, Volume 5 Environmental Management, pp. 93-95. http://www.cfo.doe.gov/budget/08budget/Start.htm (Detailed Budget Justifications, Volume 5 Environmental Management, pp. 371-373.) (Last visited April 24, 2008.)
- 52 U.S. Department of Energy, FY 2008 DOE Budget Request to Congress. “Fusion Energy Sciences: Funding Profile by Subprogram,” Volume 4 Science, pp. 371-373. http://www.cfo.doe.gov/budget/08budget/Start.htm (Detailed Budget Justifications, Volume 4 Science), (Last visited April 24, 2008.)
- 53 U.S. Department of Energy, FY 2008 DOE Budget Request to Congress, “Appropriation Summary by Programs”, Volume 3 Energy Supply and Conservation, pp. 521 and 524. http://www.cfo.doe.gov/budget/08budget/Start.htm (Detailed Budget Justifications, Volume 3 Energy Supply and Conservation), (Last visited April 24, 2008.)
- 54 U.S. Department of Energy, FY 2008 DOE Budget Request to Congress, “Appropriation Summary by Programs”, Volume 3 Energy Supply and Conservation, pp. 521 and 524. http://www.cfo.doe.gov/budget/08budget/Start.htm (Detailed Budget Justifications, Volume 3 Energy Supply and Conservation), (Last visited April 24, 2008.)
- 55 U.S. Department of Energy, FY 2008 DOE Budget Request to Congress, “Appropriation Summary by Programs”, Volume 3 Energy Supply and Conservation, pp. 521 and 525. http://www.cfo.doe.gov/budget/08budget/Start.htm (Detailed Budget Justifications, Volume 3 Energy Supply and Conservation), (Last visited April 24, 2008.)
- 56 U.S. Department of Energy, FY 2008 DOE Budget Request to Congress, “Appropriation Summary by Programs”, Volume 3 Energy Supply and Conservation, pp. 521 and 525. http://www.cfo.doe.gov/budget/08budget/Start.htm (Detailed Budget Justifications, Volume 3 Energy Supply and Conservation), (Last visited April 24, 2008.)
- 57 U.S. Department of Energy, FY 2008 DOE Budget Request to Congress, “Appropriation Summary by Programs”, Volume 3 Energy Supply and Conservation, pp. 521 and 525. http://www.cfo.doe.gov/budget/08budget/Start.htm (Detailed Budget Justifications, Volume 3 Energy Supply and Conservation), (Last visited April 24, 2008.)
- 58 Tennessee Valley Authority, “Frequently Asked Questions About TVA,” pp. 4-5, http://www.tva.gov/abouttva/keyfacts.htm. (Last visited April 24, 2008.)
- 59 U.S. General Accounting Office, Tennessee Valley Authority: Plans to Reduce Debt While Meeting Demand for Power (Washington, D.C., August 2006), p.5, http://www.gao.gov/new.items/d06810.pdf. (Last visited April 24, 2008.)
- 60 U.S. Office of Management and Budget, Analytical Perspectives: Budget of the United States Government, Fiscal Year 2008 , p. 229, http://www.whitehouse.gov/omb/budget/fy2008/pdf/spec.pdf. (Last visited April 24, 2008.)
- 61 U.S. General Accounting Office, Tennessee Valley Authority: Information on Lease-Leaseback and Other Financing Arrangements (Washington, D.C., June 2003), p. 6, http://www.gao.gov/new.items/d03784.pdf. (Last visited April 24, 2008.)
- 62 U.S. General Accounting Office, Tennessee Valley Authority: Financial Problems Raise Questions about Long Term Viability (Washington, D.C., August 1995), pp. 5-6, http://www.gao.gov/archive/1995/ai95134.pdf. (Last visited April 24, 2008.)
- 63 U.S. Congressional Budget Office, Budget Options, March 2003 (Washington, D.C., March 2003), p. 70, http://www.cbo.gov/ftpdocs/40xx/doc4066/EntireReport.pdf. (Last visited April 24, 2008.)
- 64 U.S. Office of Management and Budget, Analytical Perspectives: Budget of the United States Government, 2008, p. 301.
- 65 U.S. Energy Information Administration, Federal Financial Interventions and Subsidies in Energy Markets 1999: Primary Energy , pp. 108-109, http://www.eia.doe.gov/oiaf/servicerpt/subsidy/pdf/sroiaf(99)03.pdf. (Last visited April 24, 2008.)
- 66 U.S. Government Accountability Office, Federal Electricity Subsidies: Information on Research Funding, Tax Expenditures, and Other Activities That Support Electricity Production (October 2007), p.53, www.gao.gov/new.items/d08102.pdf. (Last visited April 24, 2008.)
- 67 U.S. Department of Energy, Office of Nuclear Energy, “Energy Policy Act of 2005”, http://www.ne.doe.gov/energyPolicyAct2005/neEPACT2a.html. (Last visited April 29, 2008.)
- 68 U.S. Department of Energy, “United States (Federal) Alternative Fuel Dealer”, http://www.eere.energy.gov/afdc/progs/view_ind_mtx.cgi?user/AFS/US/0. (Last visited April 24, 2008.)
- 69 U.S. Treasury, Internal Revenue Service, “Internal Revenue Manual, Part 21, Customer Account Services, Chapter 7, Business Tax Returns and Non-Master File Accounts, Section 4, Income Taxes, Information Returns (Cont. 3),” p.3, http://www.irs.gov/irm/part21/ch07s10.html. (Last visited April 24, 2008.)
- 70 U.S. Internal Revenue Service, “Form 6478, Credit for Alcohol Used as Fuel”, http://www.irs.gov/pub/irs-pdf/f6478.pdf. (Last visited April 24, 2008.)
- 71 U.S. Office of Management and Budget, Analytical Perspectives, Budget of the United States Government, Fiscal Year 2008 , p. 291, http://www.whitehouse.gov/omb/budget/fy2008/pdf/spec.pdf. (Last visited April 24, 2008.)
- 72 Testimony by Keith Collins, chief economist, U.S. Department of Agriculture, before the U.S. Senate Committee on Agriculture, Nutrition, and Forestry, Washington, D.C., January 10, 2007. http://www.usda.gov/oce/newsroom/congressional_testimony/Collins_011007.pdf. (Last visited April 24, 2008.), and U.S. Department of Agriculture, Commodity Credit Corporation, Commodity Estimates Book, FY 2008 President’s Budget, (Washington, D.C, February 5, 2007), p. 1. http://www.fsa.usda.gov/Internet/FSA_File/pb08_tbl35a.pdf. (Last visited April 24, 2008.)
- 73 The United State International Trade Commission, The Economic Effects of Significant U.S. Import Restraints, Fourth Update, 2004, (Washington, D.C., June 2004), p. 47, http://hotdocs.usitc.gov/docs/pubs/332/pub3701.pdf. (Last visited April 24, 2008.), and The United States International Trade Commission, The Economic Effects of Significant U.S. Import Restraints, Fifth Update, 2007, (Washington, D.C., February 2007), pp. 43-45, http://hotdocs.usitc.gov/docs/Pubs/332/Pub3906.pdf. (Last visited April 24, 2008.)
- 74 Email and spreadsheet from Douglas Newman, U.S. International Trade Commission, October 31, 2007.
- 75 Congressional Research Service, Fuel Ethanol: Background and Public Policy Issues , by Brent D. Yacobucci (Washington, D.C., July 30, 2007), p. 21, http://www.nationalaglawcenter.org/assets/crs/RL33290.pdf. (Last visited April 24, 2008.)
- 76 U.S. Senate, Finance Committee, Finance Committee Staff Summary: Energy Advancement and Investment Act of 2007 , (Washington, D.C., June 14, 2007), p.3, http://finance.senate.gov/sitepages/leg/LEG 2007/Leg 110 061507.pdf. (Last visited April 24, 2008.)
- 77 Email from Douglas Newman, U.S. International Trade Commission, November 14, 2007.
- 78 Email and spreadsheet from Douglas Newman, U.S. International Trade Commission, October 31, 2007, and Congressional Budget Office, Cost Estimate, Heartland, Habitat, Harvest, and Horticulture Act of 2007 , (Washington, D. C, October 29, 2007), p. 5, http://www.cbo.gov/ftpdocs/87xx/doc8760/Heartland.pdf. (Last visited April 24, 2008.)
- 79 U.S. Department of Energy, Energy Efficiency and Renewable Energy, FY 2006 Budget-in-Brief, (Washington, D.C., February 7, 2005), pp. 6-7. http://www1.eere.energy.gov/ba/pba/pdfs/fy06_budget_brief.pdf. (Last visited April 24, 2008.)
- 80 U.S. Department of Energy, FY 2007 Operating Plan by Appropriation, http://www.cfo.doe.gov/budget/fy07opsplan/executionfy07opplan.pdf. (Last visited April 24, 2008.)
- 81 Tex. Tax Code § 23 (Texas Legislative Council, 2007), http://tlo2.tlc.state.tx.us/statutes/docs/TX/content/htm/tx.001.00.000023.00.htm. (Last visited April 24, 2008.)
- 82 U.S. Treasury, Internal Revenue Service, “Internal Revenue Manual, Part 21, Customer Account Services, Chapter 7, Business Tax Returns and Non-Master File Accounts, Section 4, Income Taxes, Information Returns (Cont. 3),” pp. 22-23, http://www.irs.gov/irm/part21/ch07s10.html. (Last visited April 24, 2008.)
- 83 U.S. Treasury, Internal Revenue Service, “Form 8864, Biodiesel and Renewable Diesel Fuels Credit, 2007”, http://www.irs.gov/pub/irs-pdf/f8864.pdf. (Last visited April 24, 2008.)
- 84 U.S. Office of Management and Budget, Analytical Perspectives, Budget of the United States Government, Fiscal Year 2008 , p. 292, http://www.whitehouse.gov/omb/budget/fy2008/pdf/spec.pdf. (Last visited April 24, 2008.)
- 85 U.S. Department of Energy, “United States (Federal) Alternative Fuel Dealer,” p.1, http://www.eere.energy.gov/afdc/progs/view_ind_mtx.php/user/AFS/US/print. (Last visited April 24, 2008.)
- 86 Email from Curtis Carlson, Office of Tax Analysis, U.S. Department of Treasury, April 9, 2008.
- 87 U.S. Department of Agriculture, “What is the Section 9006 Program?” http://www.rurdev.usda.gov/rbs/farmbill/what_is.html. (Last visited April 24, 2008.)
- 88 U.S. Department of Agriculture, Rural Development, “Section 9006: Renewable Energy and Energy Efficiency Program,” p.1, http://www.rurdev.usda.gov/rbs/farmbill/index.html. (Last visited April 24, 2008); and “Renewable Energy and Energy Efficiency Improvement Program Grants,” http://www.rurdev.usda.gov/rd/newsroom/2006/9006GrantRecipients.pdf. (Last visited April 24, 2008.)
- 89 Tex. Agriculture Code §16.004.
- 90 Email from Allen Regehr, Program Administrator, Texas Department of Agriculture, January 17, 2008.
- 91 U.S. Office of Management and Budget, Analytical Perspectives, Budget of the United States Government, Fiscal Year 2008 , p. 301, http://www.whitehouse.gov/omb/budget/fy2008/pdf/spec.pdf. (Last visited April 24, 2008.)
- 92 U. S. Department of Energy, Energy Information Administration, Federal Financial Interventions and Subsidies in Energy Markets 1999: Primary Energy, Footnotes (Washington, D.C., September 1999), http://www.eia.doe.gov/oiaf/servicerpt/subsidy/footnotes.html. (Last visited April 24, 2008.)
- 93 American Public Power Association, Understanding the Clean Renewable Energy Bond Program, (Washington, D.C.) http://www.appanet.org/files/PDFs/CREB.pdf. (Last visited April 24, 2008.)
- 94 U.S. Department of Energy, Energy Efficiency and Renewable Energy, Renewable Energy Production Incentive , http://www.eere.energy.gov/repi/. (Last visited April 24, 2008); and U.S. Department Energy, Energy Efficiency and Renewable Energy, “Renewable Energy Production Incentive, About the Program,” http://www.eere.energy.gov/repi/about.cfm. (Last visited April 24, 2008.)
- 95 U.S. Department of Energy, Energy Efficiency and Renewable Energy, Renewable Energy Production Incentive, Projects by State , http://www.eere.energy.gov/repi/projects.cfm. (Last visited April 24, 2008.)
- 96 U.S. Department of Defense, Defense Advanced Research Projects Agency, Fiscal Year 2008/2009 Budget Estimates, Volume 1 (Washington, D. C., February 2007), pp. 181-183, 189, 194, 248-249, 251, 263, 266, 392, http://www.darpa.mil/body/pdf/FY08_budg_est.pdf. (Last visited April 24, 2008.)
- 97 U.S. Department of Defense, Defense Advanced Research Projects Agency, Department of Defense Fiscal Year (FY) 2008/2009 Budget Estimates , (Washington, D.C., February 2007), pp. 182-183, 188-189, 194, 251, 263, 391-392. http://www.darpa.mil/body/pdf/FY08_budg_est.pdf. (Last visited April 24, 2008.)
- 98 U. S. Department of Energy, FY 2007 Operating Plan by Appropriation, p. 5.
- 99 U.S. Internal Revenue Service, “Form 5695, Residential Energy Credits,” pp. 2, 4, 6, http://www.irs.gov/pub/irs-pdf/f5695.pdf. (Last visited April 24, 2008.)
- 100 U.S. Office of Management and Budget, Analytical Perspectives: Budget of the United States Government, Fiscal Year 2008 , p. 301, http://www.whitehouse.gov/omb/budget/fy2008/pdf/spec.pdf. (Last visited April 24, 2008.)
- 101 U.S. Office of Management and Budget, Analytical Perspectives: Budget of the United States Government, Fiscal Year 2008 , p. 301, http://www.whitehouse.gov/omb/budget/fy2008/pdf/spec.pdf. (Last visited April 24, 2008.)
- 102 U.S. Department of Energy, The Borrower’s Guide to Financing Solar Energy Systems: A Federal Overview , 2nd ed., (Washington, D.C., March 1999), pp. 10-11, http://www.nrel.gov/docs/fy99osti/26242.pdf. (Last visited April 24, 2008.)
- 103 U.S. Department of Energy, The Borrower’s Guide to Financing Solar Energy Systems: A Federal Overview , 2nd ed., pp.12-13, http://www.nrel.gov/docs/fy99osti/26242.pdf. (Last visited April 24, 2008.)
- 104 U.S. Department of Agriculture, Rural Development, Rural Utilities Programs, Assistance for Rural Electric Utilities , (Washington, D.C., November 2004), http://www.rurdev.usda.gov/rd/pubs/pa1789.pdf. (Last visited April 24, 2008.)
- 105 Kenneth M. Ackerman, Assistant Administrator, Program Accounting and Regulatory Analysis, Rural Development Utilities Program: Presentation to NARUC Staff Subcommittee on Accounting and Finance, Albuquerque, New Mexico, April 23, 2007 , p.4. http://www.usda.gov/rus/pasd/presentations/Ackerman-NARUC-Albuquerque-2007-April.pdf. (Last visited April 24, 2008.)
- 106 U.S. General Accountability Office, Federal Electricity Subsidies: Information on Research Funding, Tax Expenditures, and Other Activities that Support Electricity Production, (Washington, D.C., October 2007), http://www.gao.gov/new.items/d08102.pdf. (Last visited April 24, 2008.)
- 107 U.S. Department of Energy, Energy Efficiency and Renewable Energy, Renewable Energy Production Incentive, Projects by State , http://www.eere.energy.gov/repi/projects.cfm. (Last visited April 24, 2008.)
- 108 Database of State Incentives for Renewables & Efficiency, “Texas Incentives for Renewables and Efficiency: Solar and Wind Energy Device Franchise Tax Deduction,” pp.1-2, http://www.dsireusa.org/library/includes/incentive2.cfm?Incentive_Code=TX04F&state=TX&CurrentPageID=1&RE=1&EE=1. (Last visited April 24, 2008.)
- 109 Database of State Incentives for Renewables & Efficiency, “Texas Incentives for Renewables and Efficiency: Austin Energy - Solar PV Rebate Program,” pp. 1-2, http://www.dsireusa.org/library/includes/incentive2.cfm?Incentive_Code=TX11F&state=TX&CurrentPageID=1&RE=1&EE=1. (Last visited April 24, 2008.)
- 110 Interview with Jerrel Gustafson, Austin Energy, Austin, Texas, November 2, 2007.
- 111 Database of State Incentives for Renewables & Efficiency, “Texas Incentives for Renewables and Efficiency: Austin Energy - Solar Water Heating Rebate,” pp. 1-2, http://www.dsireusa.org/library/includes/incentive2.cfm?Incentive_Code=TX05F&state=TX&CurrentPageID=1&RE=1&EE=1. (Last visited April 24, 2008.)
- 112 Database of State Incentives for Renewables & Efficiency, “Texas Incentives for Renewables and Efficiency: Big Country Electric Coop - PV Water Pump Sales & Lease Program,” pp. 1-2, http://www.dsireusa.org/library/includes/incentive2.cfm?Incentive_Code=TX08F&state=TX&CurrentPageID=1&RE=1&EE=1. (Last visited April 24, 2008.)
- 113 Interview with Cindy Lewis, Big Country Electric Coop, Roby, Texas, November 5, 2007.
- 114 U.S. Department of Energy, “Power Marketing Administrations,” pp. 1-3, http://www.energy.gov/organization/powermarketingadmin.htm. (Last visited April 24, 2008.)
- 115 U.S. Congressional Budget Office, Budget Options, March 2003 (Washington, D.C., March 2003), p. 64, http://www.cbo.gov/ftpdocs/40xx/doc4066/EntireReport.pdf. (Last visited April 24, 2008.)
- 116 National Performance Review, “Department of Energy, DOE04: Increase Electrical Power Revenues and Study Rates,” pp.1-4, http://govinfo.library.unt.edu/npr/library/reports/doe04.html. (Last visited April 24, 2008.)
- 117 U.S. Congressional Budget Office, Budget Options, March 2003 (Washington, D.C., March 2003), p. 64, http://www.cbo.gov/ftpdocs/40xx/doc4066/EntireReport.pdf. (Last visited April 24, 2008.)
- 118 Federal Energy Regulatory Commission, Renewable Energy Production Tax Credit: Instructions for Requesting Certification of Incremental Hydroelectric Production Pursuant to the Energy Policy Act of 2005 (Washington, D. C. March 2007), pp. 1-2, http://www.ferc.gov/industries/hydropower/gen-info/comp-admin/credit-cert.pdf. (Last visited April 24, 2008.)
- 119 U.S. Congressional Budget Office, “Curtail Income Tax Preferences for Businesses,” pp. 10-11, http://www.cbo.gov/ftpdoc.cfm?index=1222&type=0&sequence=25. (Last visited April 24, 2008.)
- 120 L. Louis Hyman, “Taxes and Your Forestry Investment,” Alabama’s Treasured Forests (Fall 2007), p. 14, http://www.forestry.alabama.gov/publication/TF_publications/TFfall07/Taxes_and_Your_Forestry_Investment.pdf. (Last visited April 24, 2008.)
- 121 Michigan State University Extension, “Forestry Fact Sheet 29, Tax Treatment of Reforestation Costs,” January 2001, p. 1, http://forestry.msu.edu/extension/extdocs/facts29.pdf. (Last visited April 24, 2008.)
- 122 U.S. Department of Energy, Energy Efficiency and Renewable Energy, Renewable Energy Production Incentive, Projects by State , http://www.eere.energy.gov/repi/projects.cfm. (Last visited April 24, 2008.)
- 123 U.S. Department of Energy, Energy Efficiency and Renewable Energy, FY 2006 Budget in Brief, pp. 16-17.
- 124 U.S. Department of Energy, FY 2007 Operating Plan by Appropriation, p. 5.
- 125 Interviews with Jerrel Gustafson, Austin Energy, Austin, Texas, November 2, 2007; Cindy Lewis, Big Country Electric Coop, Roby, Texas, November 5, 2007; David Dzierski, CenterPoint Energy, Houston, Texas, October 26, 2007; Jane Sayers, College Station Utilities, College Station, Texas, October 29, 2007; Jan Hill, Denton Municipal Electric, Denton, Texas, November 2, 2007; Jay Pratts, Farmers Electric Coop, Greenville, Texas, November 7, 2007; Jake Brooks, United Coop Services, Cleburne, Texas, October 31, 2007.
- 126 U.S. Department of Energy, Energy Efficiency and Renewable Energy, State Energy Program, Information Resources, State Energy Program Operations Manual , pp. 1-3 – 1-10, A-1 – A-5, (Washington, D.C., January 2003), http://www.eere.energy.gov/state_energy_program/pdfs/sepopman_32982.pdf. (Last visited April 24, 2008.)